


 Download the 2019 Clergy Age Trends Report.
Highlights of the 2019 Report
Dramatic Decline in the Number of Young Elders
Not only did the number of elders under 35 decline for the third consecutive year, the decline in 2019 is the largest since these reports began in 2005. In addition to the unprecedented size of the decline, another difference is that while the previous losses have come primarily from female elders, in 2019 the losses came proportionately among men and women. The decline among men means there are fewer male elders under 35 than any time for which we have records. Similarly, there are fewer young female elders than since 2008.
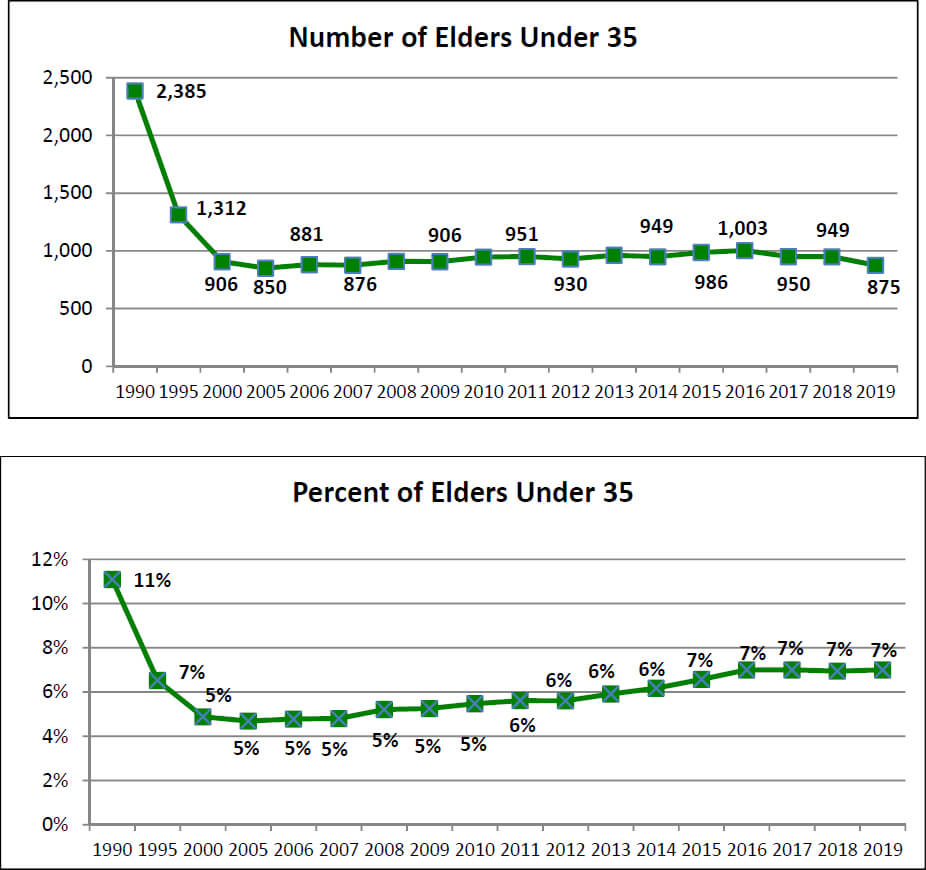
There was a decline of 74 young elders, 875 in 2019 compared to 949 the previous year. This is the lowest number of young elders since the record low year of 2005 in which there were only 850 elders under 35.
Young female elders reached a high point in numbers in 2015 with 404. The number in 2019 is 325. In terms of their percentage of young elders, the high point was in 2015 at 41 percent. The comparable figure in 2019 is 37 percent.
Interestingly, due to the overall decline in the total number of active elders in the United Methodist Church, the percentage of young elders of all active elders remains around 7 percent, up from the record low of 5 percent in 2005.
Middle Age and Older Elders Mirror Recent Trends
The makeup of middle age elders (ages 35 to 54) and older elders (ages 55 to 72) remained proportionately about the same as last year even as their numbers declined. This middle age group is 37 percent of all active elders, a record low, and down from 65 percent in 2000. Elders between ages 55 and 72 comprise 56 percent of elders in 2017, a record high, and up from 30 percent as recently as 2000.
Fewer Elders and More Local Pastors
Elders and local pastors are appointed as pastors of congregations. Since at least the 1980s there has been a major decline in the number of active elders while the number of local pastors increased dramatically. This pattern continues in 2019. There are 514 fewer elders and 25 more local pastors in 2019 than in 2018. The result is that since 1990 there are 8,352 fewer elders and 3,627 more local pastors. In 1990, there were over five elders for each local pastor; today there are fewer than two elders for each local pastor. In 2019, there are 13,155 elders and 7,563 local pastors.
Baby Boomers Are Retiring Somewhat Later
In recent years, there has been about a two-year increase in the age of retirement for all categories of clergy. The increase when all clergy groups are combined is from an average retirement age of 64 to 66. The first of the Baby Boomer generation reached 65 in 2011. While there are many variables in determining when someone retires, the increased retirement age of Boomer retirees matches patterns seen outside the church as well. The average retirement age across all clergy categories in 2018, the last full year of data, was 66.2, unchanged from the year before. The retirement ages for different types of clergy are similar but not the same. For example, in 2018 the retirement ages were: elders–66, deacons-66, full time local pastors–68, and part time local pastors–69.
Download the 2019 Clergy Age Trends Report.
Previous Clergy Age Trends Reports
![]() 2018 | 2017 | 2016 | 2015 | 2014 | 2013 | 2012 | 2011 | 2010 | 2009 | 2008 | 2007 | 2006
2018 | 2017 | 2016 | 2015 | 2014 | 2013 | 2012 | 2011 | 2010 | 2009 | 2008 | 2007 | 2006


