

![]()
 Download the 2021 Clergy Age Trends Report.
Highlights of the 2021 Report
Young Elders Decline to Record Low Number
Click on the graphs to enlarge them.
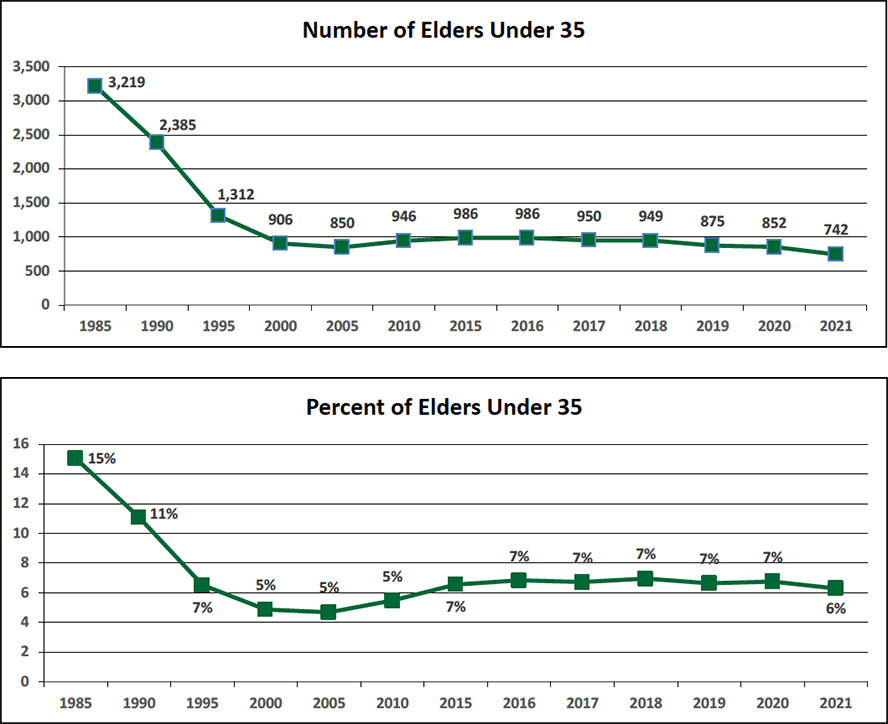
The recent decline in the number of young elders (under 35) began in 2017 and followed modest gains after the low point of 2005. That decline continues; however, the scale of the decline in 2021 is larger than seen before. The number of young elders in 2021 is 742, far below the previous low of 852 reported in 2005. The losses in 2021 were comparable for men and women based on the proportion of each among young elders. The larger declines began in 2019. Since then, the decline in young elders has been 207, or a 24% decline. While the overall number of active elders in the United Methodist Church continued to decline in 2021, the annual rate of decline was 7% compared to 15% for young elders. Young elders constitute 6% of active elders in 2021 compared to 7% in 2020.
Some Shifting from Older to Middle Age Elders
Since 2000, we have been watching a trend of having fewer elders in the middle age (35-54) group and more elders in the older (55-72) group. Since those in the older group face a mandatory retirement age of 72, with most retiring before that age, it seemed that this expanding pool of older elders could not continue to grow indefinitely. After 20 years of growth, one began to wonder whether such a decline might ever happen. Last year there was a modest turn in this trend, with a 1% shift from the older group to the middle age group.
In 2021, there is another 1% decline in older elders as a percentage of the whole. Older elders now comprise 54% of all elders. (They comprised 30% as recently as 2000.) Middle age elders went from 38% of all elders to 40%. (They comprised 65% in 2000.) The proportional gain for the middle age group came from the 1% decline in older elders and 1% from the young elders’ decline. Keep in mind that all age groups of elders declined in raw numbers, but some declined more than others, thus the change in proportional representation.
Deacons Show Trends Similar to Elders
The numbers and ages of deacons follow similar directions as elders. There is a decline in the number of young deacons since 2019 of 23%. Young deacons comprise 10% of all active deacons in 2021, higher than the percentage for young elders, though this percentage has declined from 12% in 2019. One caution in the deacon statistics to remember is that the total number of deacons is lower in this report than their presence in the denomination. This difference is because a number of deacons serve in work settings other than congregations and have pension plans through those agencies rather than Wespath Benefits, from which our numbers come.
Local Pastors Continue to Grow in Proportion to Elders
Elders and local pastors are appointed as pastors of congregations. In 1990, there were over five elders for each local pastor; today there are 1.6 elders for each local pastor. In 2021, there are 11,771 elders and 7,243 local pastors. The decline in the total number of local pastors in 2021 was 3% compared to 6% for elders. There is a higher proportion of young local pastors (9%) compared to elders (6%). Young deacons at 10% of all deacons have the highest proportion of young clergy among the three categories.
![]() Download the 2021 Clergy Age Trends Report.
Download the 2021 Clergy Age Trends Report.
Previous Clergy Age Trends Reports
![]() 2020 | 2019 | 2018 | 2017 | 2016 | 2015 | 2014 | 2013 | 2012 | 2011 | 2010 | 2009 | 2008 | 2007 | 2006
2020 | 2019 | 2018 | 2017 | 2016 | 2015 | 2014 | 2013 | 2012 | 2011 | 2010 | 2009 | 2008 | 2007 | 2006


