
The Clergy Age Report from the Lewis Center for Church Leadership, produced in partnership with Wespath, offers an annual look at the changing age profile of United Methodist clergy. Lovett H. Weems Jr. identifies four key findings in this year’s report: the rebalancing of elder age groups, the continued scarcity of young elders, the growing presence of deacons, and the decline in local pastors.
Since 2005, the Lewis Center for Church Leadership in partnership with Wespath, the denominational pension agency, has issued annual reports on the ages of United Methodist clergy. The project covers elders, deacons, and local pastors in the five jurisdictional conferences of the United Methodist Church in the United States. The reports began due to increasing reports of annual conferences having fewer young clergy. That impression by conferences turned out to be correct and, despite noteworthy progress in some particular conferences for a time, the absence of younger clergy proportionate to the population continues to be a missing link in clergy makeup.
In 2026, Ages of Elders Are Rebalancing, Except for Young Elders
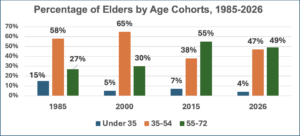
Notice in the chart below the change between 2000 and 2015 when the percentage of elders between 35 and 54 dropped from 65 percent in 2000 to 38 percent in 2015, with the percentage of elders between 55 and 72 increasing from 30 percent in 2000 to 55 percent in 2015. This major adjustment in the elder makeup reflected the aging of the historically large baby boom generation. In 2000, the youngest boomer was 36, and the oldest was 54. By 2015, the youngest boomer was 51, and the oldest was 69. By 2026, there is a rebalancing of the middle and older age cohorts. In 2026, elders between 35 and 54 are relatively close to that age group’s presence in the total population between 25 and 72. Older elders are still disproportionately represented compared to the same general population pool.
Young Elders Are Still Scarce
The chart also shows that young elders below the age of 35 (counting provisional and full elders) continue to be represented well below the presence of their age group as a proportion among the general population ages 25 to 72. The number of under-35 elders decreased from 364 to 317, continuing a ten-year decline. The decline in young men was greater than that of young women among elders, so the proportion of clergywomen among young elders is now higher than ever before at 45 percent. The percentage of young elders among all active elders declined slightly from 4.55 percent last year to 4.17 percent in 2026. The Alabama-West Florida Conference had the highest percentage of young elders at 11.8 percent. The Western North Carolina Conference had the largest number of young elders with 24.
Deacons Are Younger and An Increasing Portion of Clergy
The number of deacons and young deacons remained about the same in 2026. The age makeup of deacons is much more representative of the general population than the age makeup of elders or local pastors. The number of under-35 deacons remained the same at 59. The percentage of under-35 deacons as a percentage of all deacons remained at 7 percent. The percentage of young deacons remains above that of young elders and local pastors. The percentage of male deacons continues to increase among young deacons. They constitute 36 percent of young deacons, the highest proportion recorded to date.
Deacons are also more proportionately representative relative to elders than was previously the case. In 2005, there was one deacon for every 21 elders. In 2026, there is one deacon for every 10 elders. Not all deacons have their pensions through Wespath, in which case they are not in the data available. Conferences with the most deacons are Horizon Texas (64), Western North Carolina (55), and North Georgia (49).
There Are Fewer Local Pastors
Between 2000 and 2026 there was a dramatic decline in local pastors. In 2026, there are 48 percent fewer local pastors and 65 percent fewer under-35 local pastors. However, the ratio of elders to local pastors remains about the same, with about two elders per local pastor. Men account for two-thirds of young local pastors, but there are more women with each older age cohort until the makeup of men and women is about even in the 55-72 age group. The number of under-35 local pastors declined in 2026 to 229 from 242 in 2025. The percentage of young local pastors among all active local pastors remained at 6 percent. Since conference policies vary on including part-time local pastors in pension plans, some local pastors do not have pension accounts at Wespath, in which case they are not in the data available. Conferences with the most local pastors are Virginia (180), Missouri (141), and Great Plains (137).
We love to hear from our readers! If you have any comments, suggestions, or questions about this article, please leave a voice message directly from your computer, tablet, or smartphone via Speakpipe. You may also email lewiscenter@wesleyseminary.edu or leave a comment on Facebook, Instagram, YouTube, and Bluesky.

 Download the 2026 Clergy Age Trends Report.
Related Resources
- What Clergy Age Trends Tell Us About Church Leadership by Jonathan Page
- Church Leadership Trends for 2026 by Jonathan Page
- Is There an Ideal Age for Clergy? by Lovett H. Weems Jr.
- Previous Clergy Age Trends reports
If you would like to share this article in your newsletter or other publication, please review our reprint guidelines.