

 Introduction
Approximately 2,000 churches disaffiliated from the United Methodist Church by the end of 2022 following the passing of special disaffiliation legislation in 2019. It is anticipated that more will exercise this option by the end of 2023 when the disaffiliation legislation expires. The 2019 legislation made it possible for a church to disaffiliate and keep its property after fulfilling certain financial obligations. This report seeks to examine in what ways the departing churches are similar to or different from the profile of United Methodist churches as a whole.
Our method is to use 2019 as the comparison year since disaffiliations occurred primarily after 2019. We compare the characteristics that disaffiliating and non-disaffiliating churches had in 2019, before the disaffiliations occurred. We were able to identify the names for 1,967 of the disaffiliating churches. In 2019, there were 30,541 total United Methodist churches in the United States. Disaffiliations represented 6.6 percent of total churches. There are limitations to this approach, but we believe it serves to compare the two sets of churches at a time when we have sufficient data for almost all the churches (the total and those disaffiliating) and before the skewing of statistics that may have occurred during the heart of the pandemic. We examine three aspects for comparisons:
- pastoral leadership characteristics,
- congregational characteristics, and
- location characteristics.
Findings
There are more similarities than differences in comparing the cohort of disaffiliating churches with the total pool of all United Methodist churches. However, there are differences as well. In many categories, the percentage differences are small enough to have little significance while other categories show wider margins. The areas in which disaffiliating churches appear to vary most prominently from United Methodist churches as a whole include:- Disaffiliating churches are less likely to have an active elder as pastor.
- Disaffiliating churches are more likely to have a male pastor.
- Disaffiliating churches overwhelmingly have a majority white membership.
- Disaffiliating churches are overwhelmingly in the South.
- Disaffiliating churches are in less heavily populated counties.
Leadership Characteristics
Clergy Status Compared to all United Methodist churches, disaffiliating churches have pastors who are less likely to be an active elder and more likely to be part-time local pastors, associate members, lay supply, and retired clergy. Only 37 percent of disaffiliating churches were served by an active elder compared to 43 percent for all United Methodist churches. 43 percent for all United Methodist churches.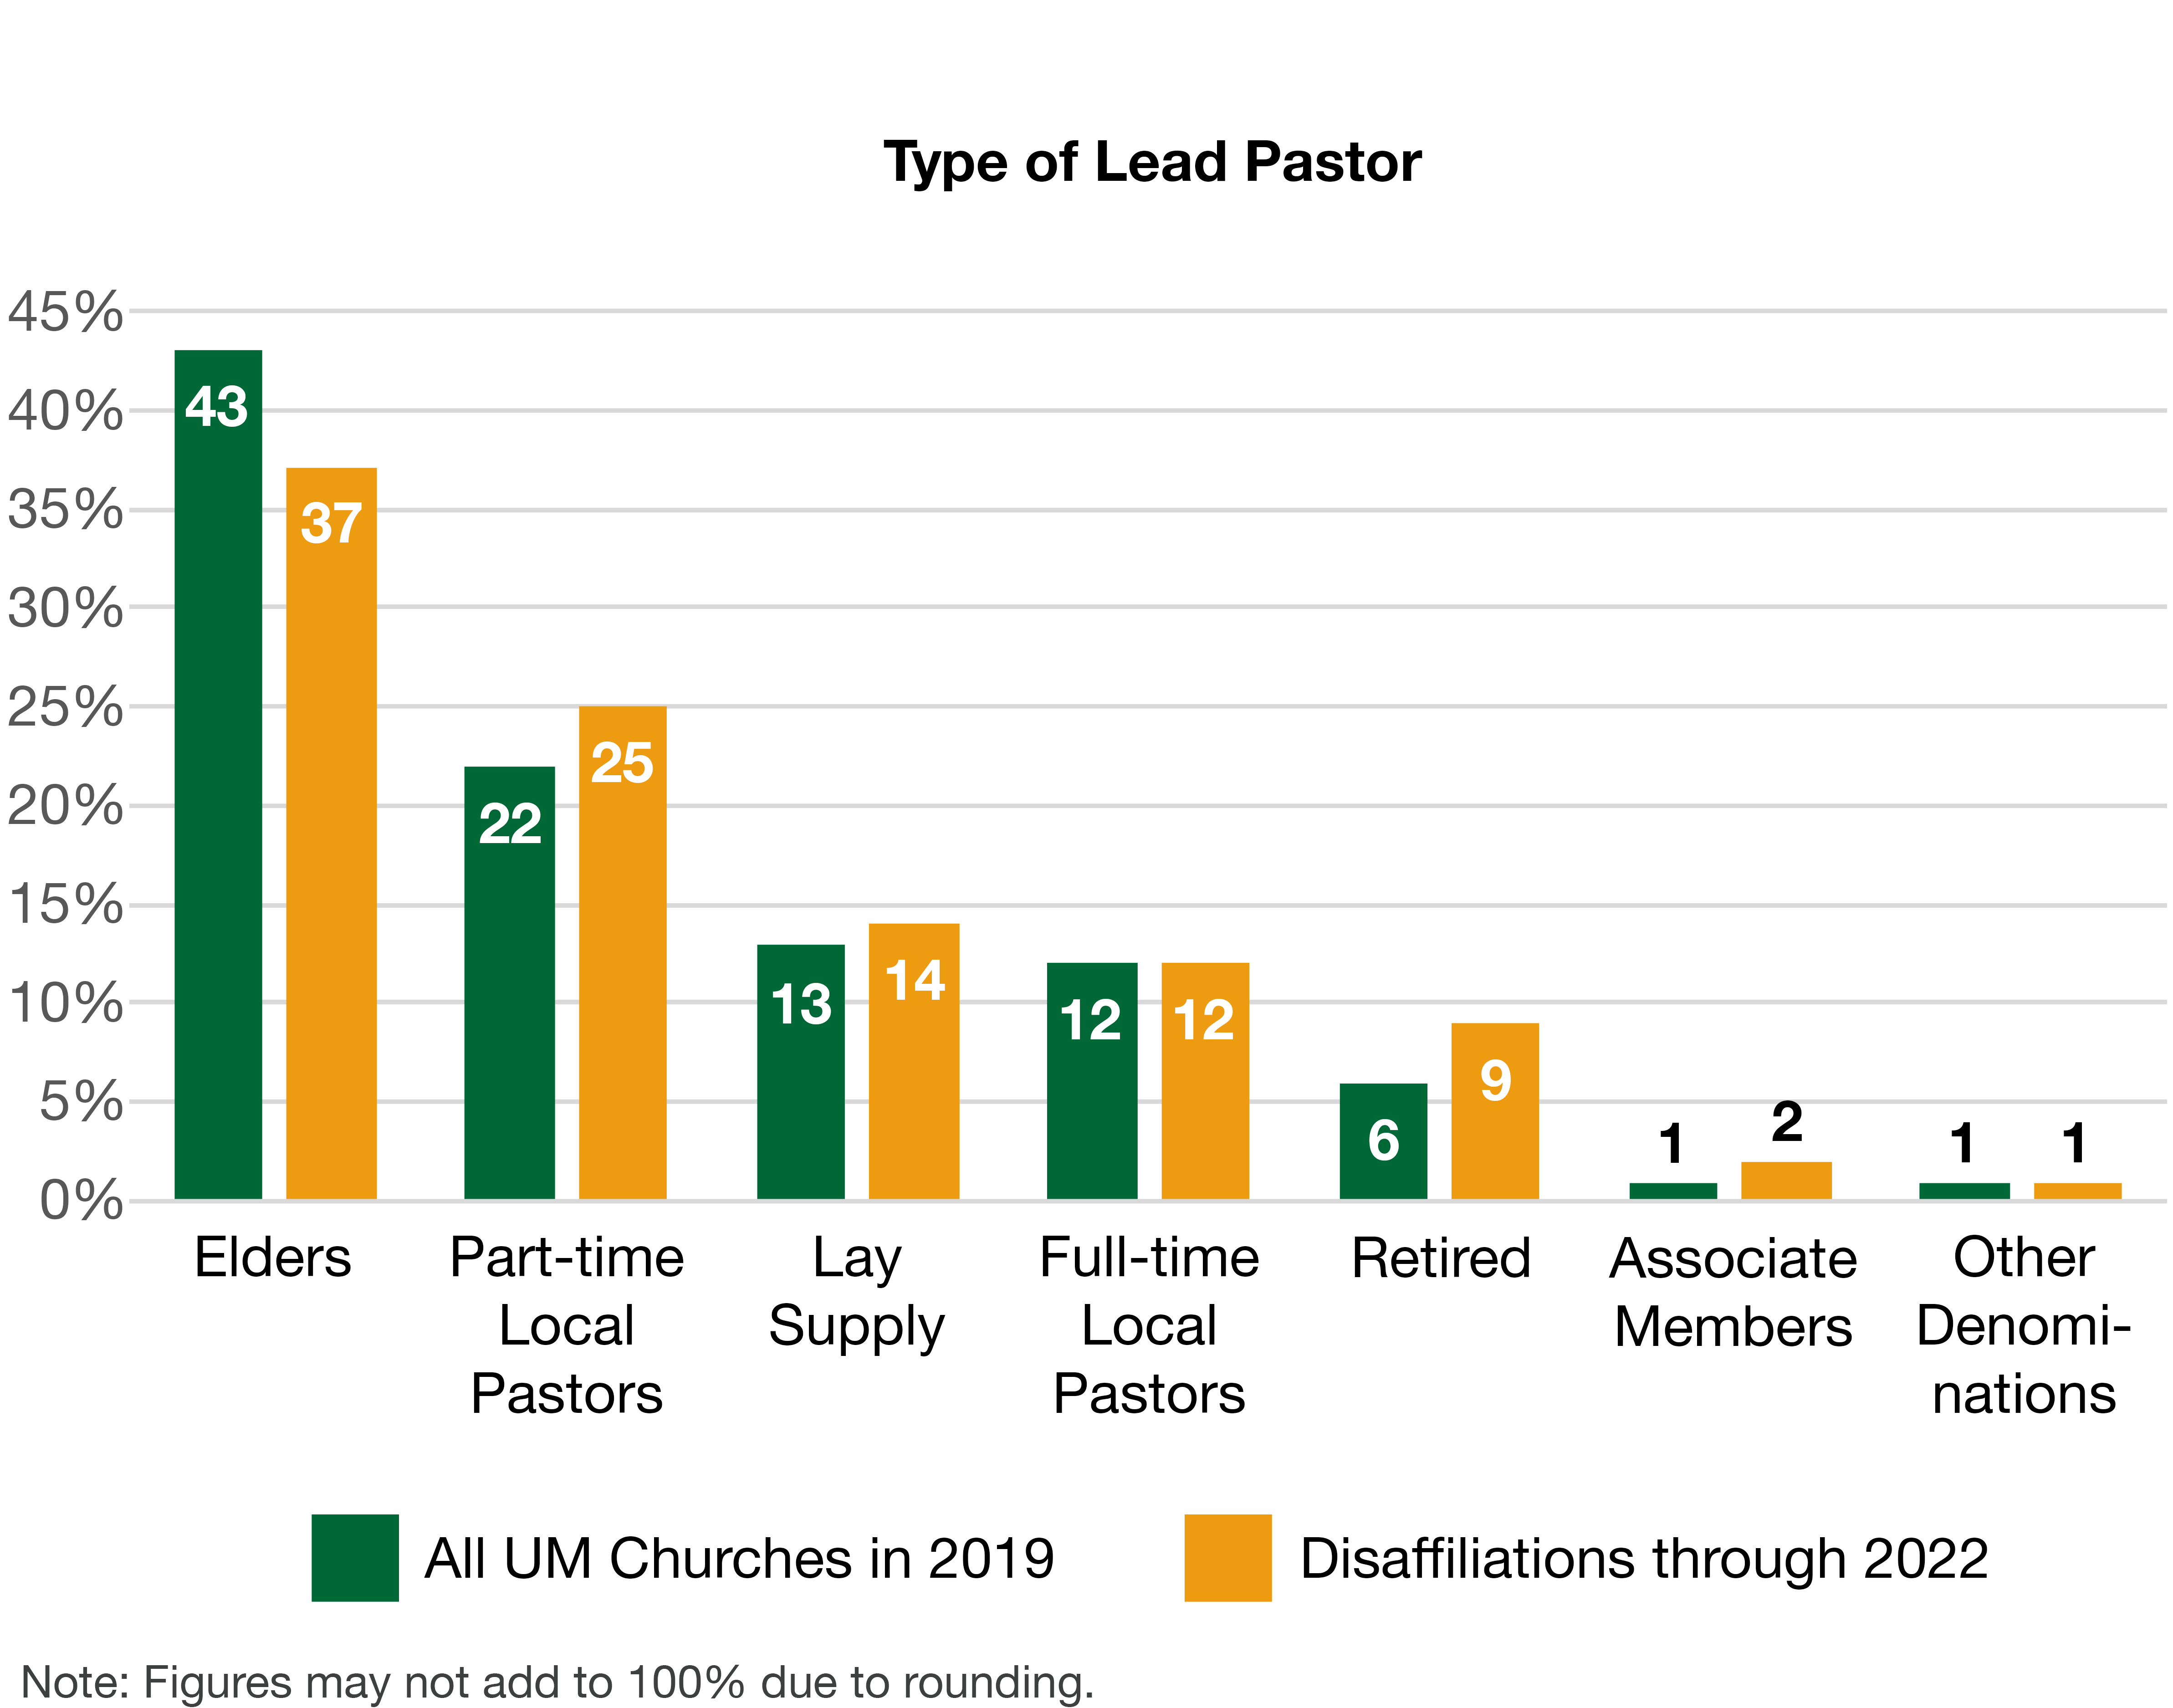 Clergy Gender
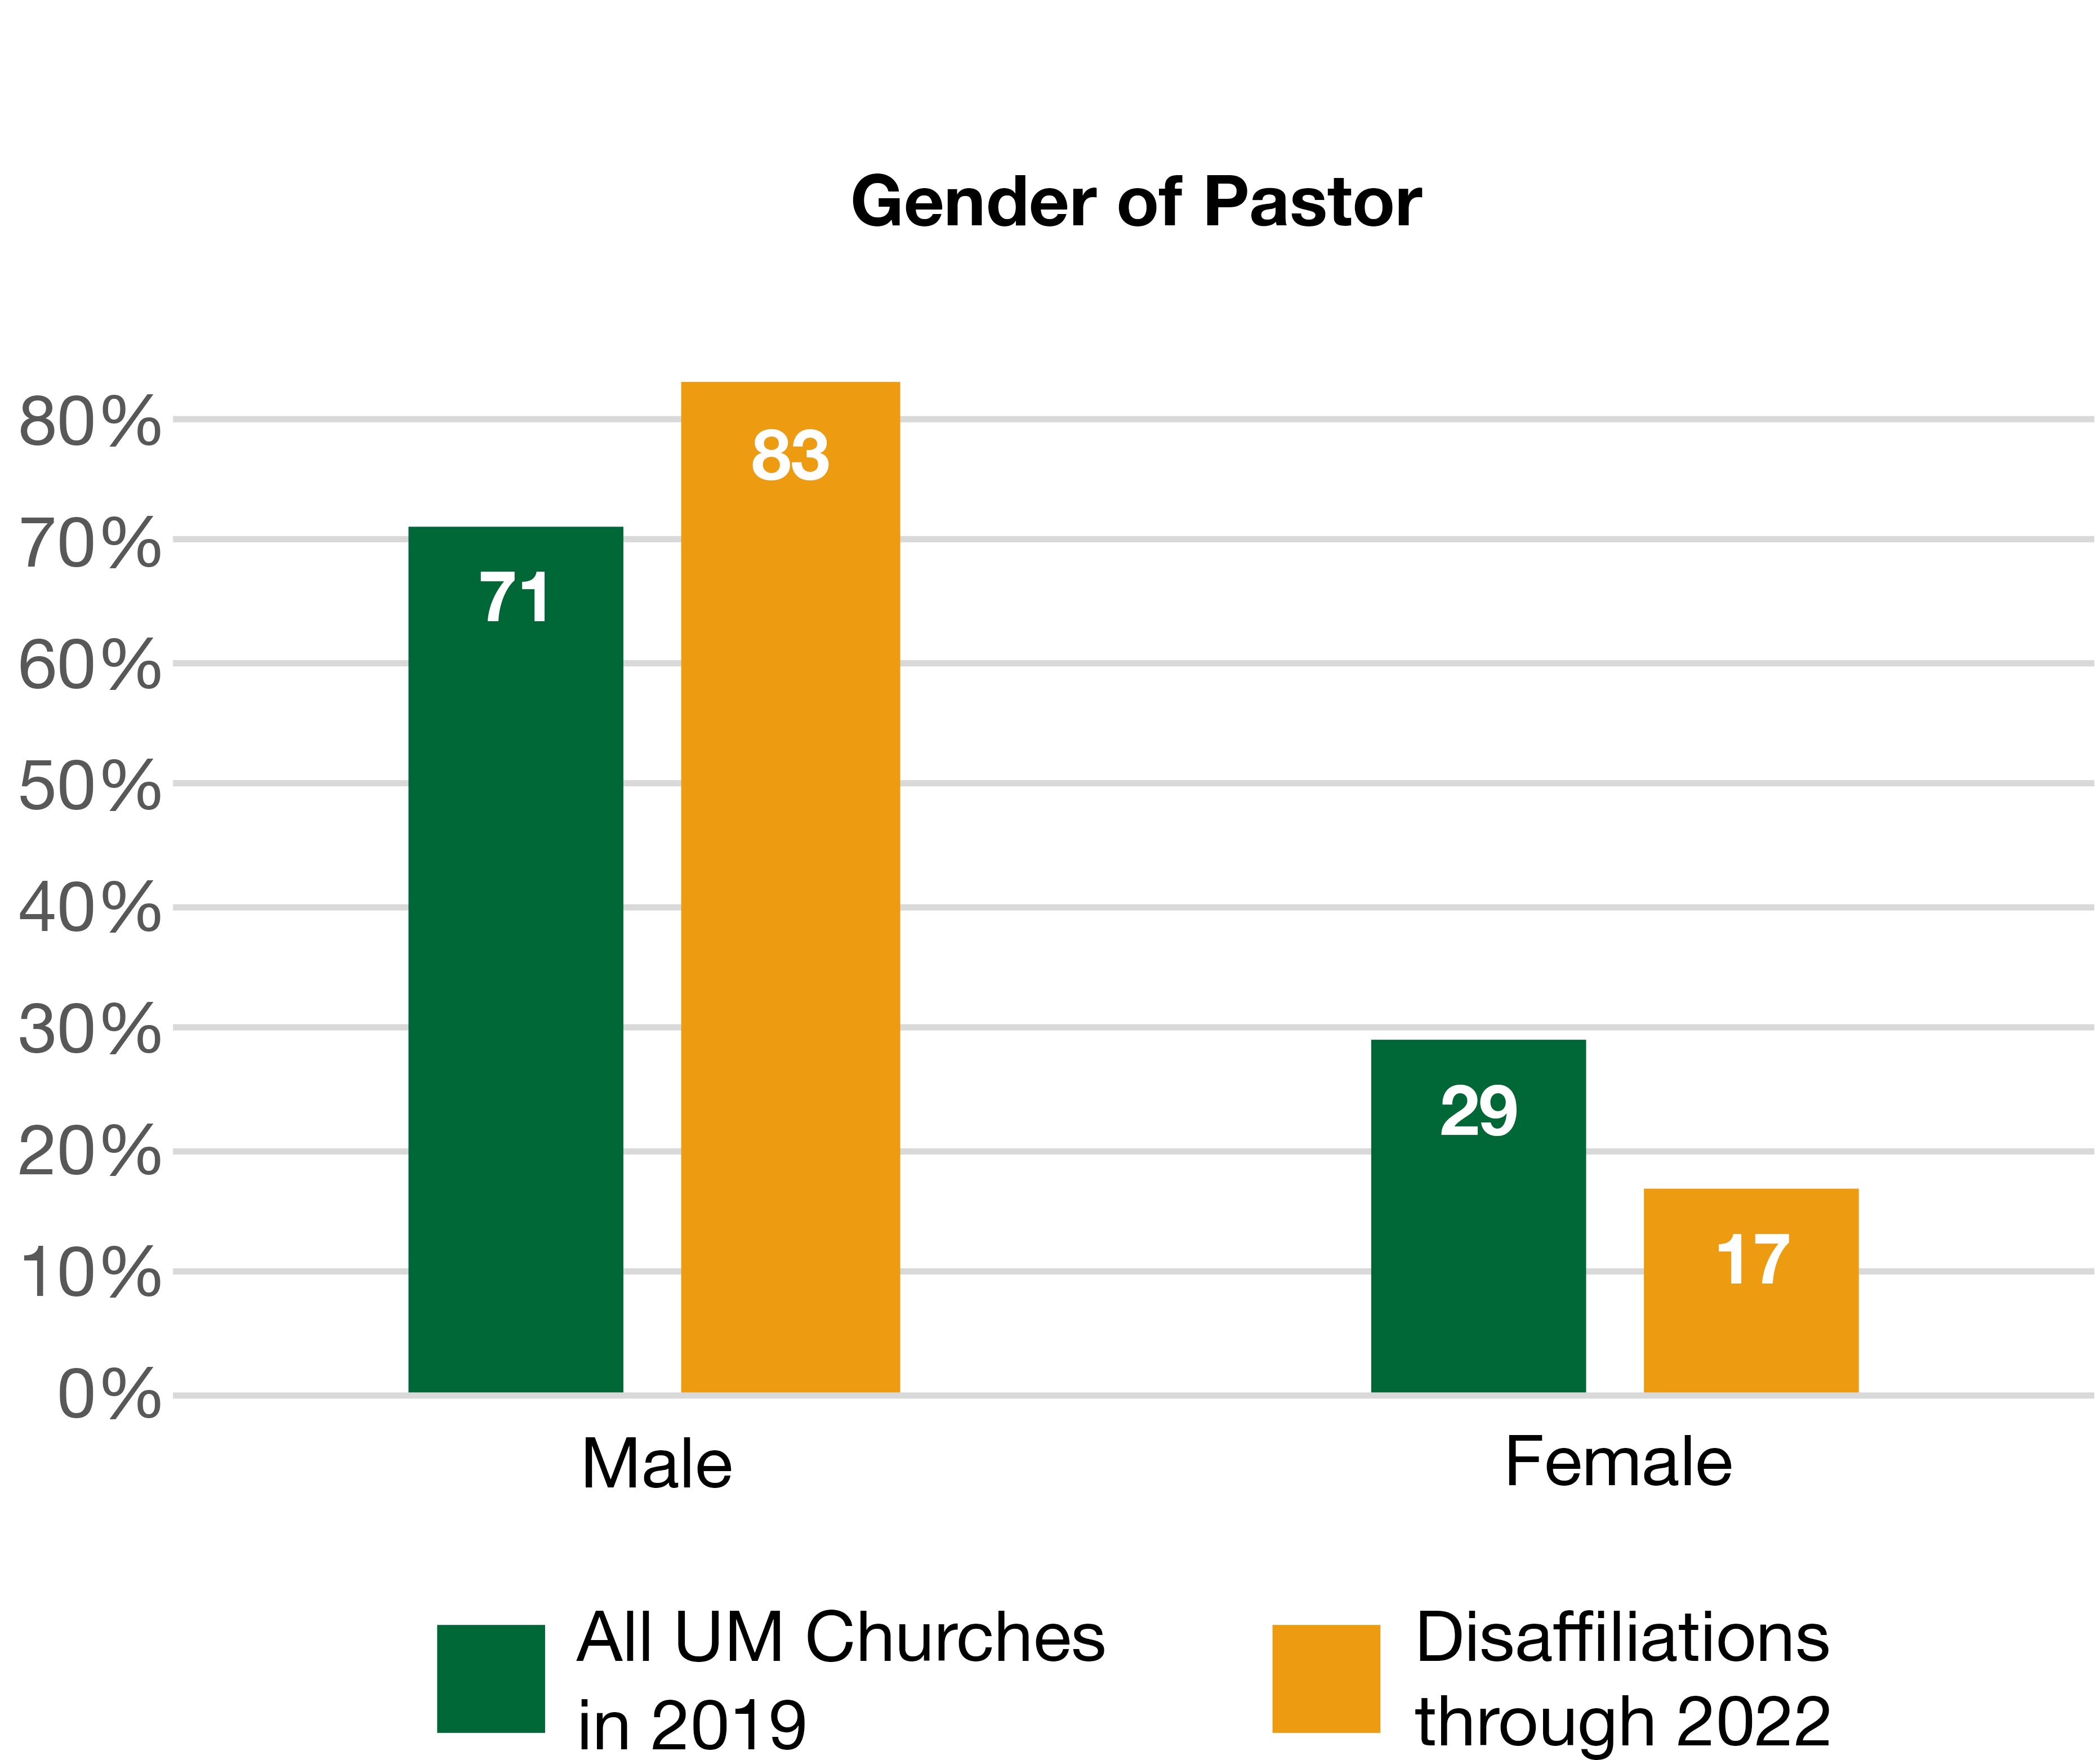
Compared to all United Methodist churches, disaffiliating churches have pastors who are more likely to be male.
Only 17 percent of disaffiliating churches have a woman as lead pastor compared to 29 percent for United Methodist churches as a whole.
Clergy Gender
Compared to all United Methodist churches, disaffiliating churches have pastors who are more likely to be male.
Only 17 percent of disaffiliating churches have a woman as lead pastor compared to 29 percent for United Methodist churches as a whole.
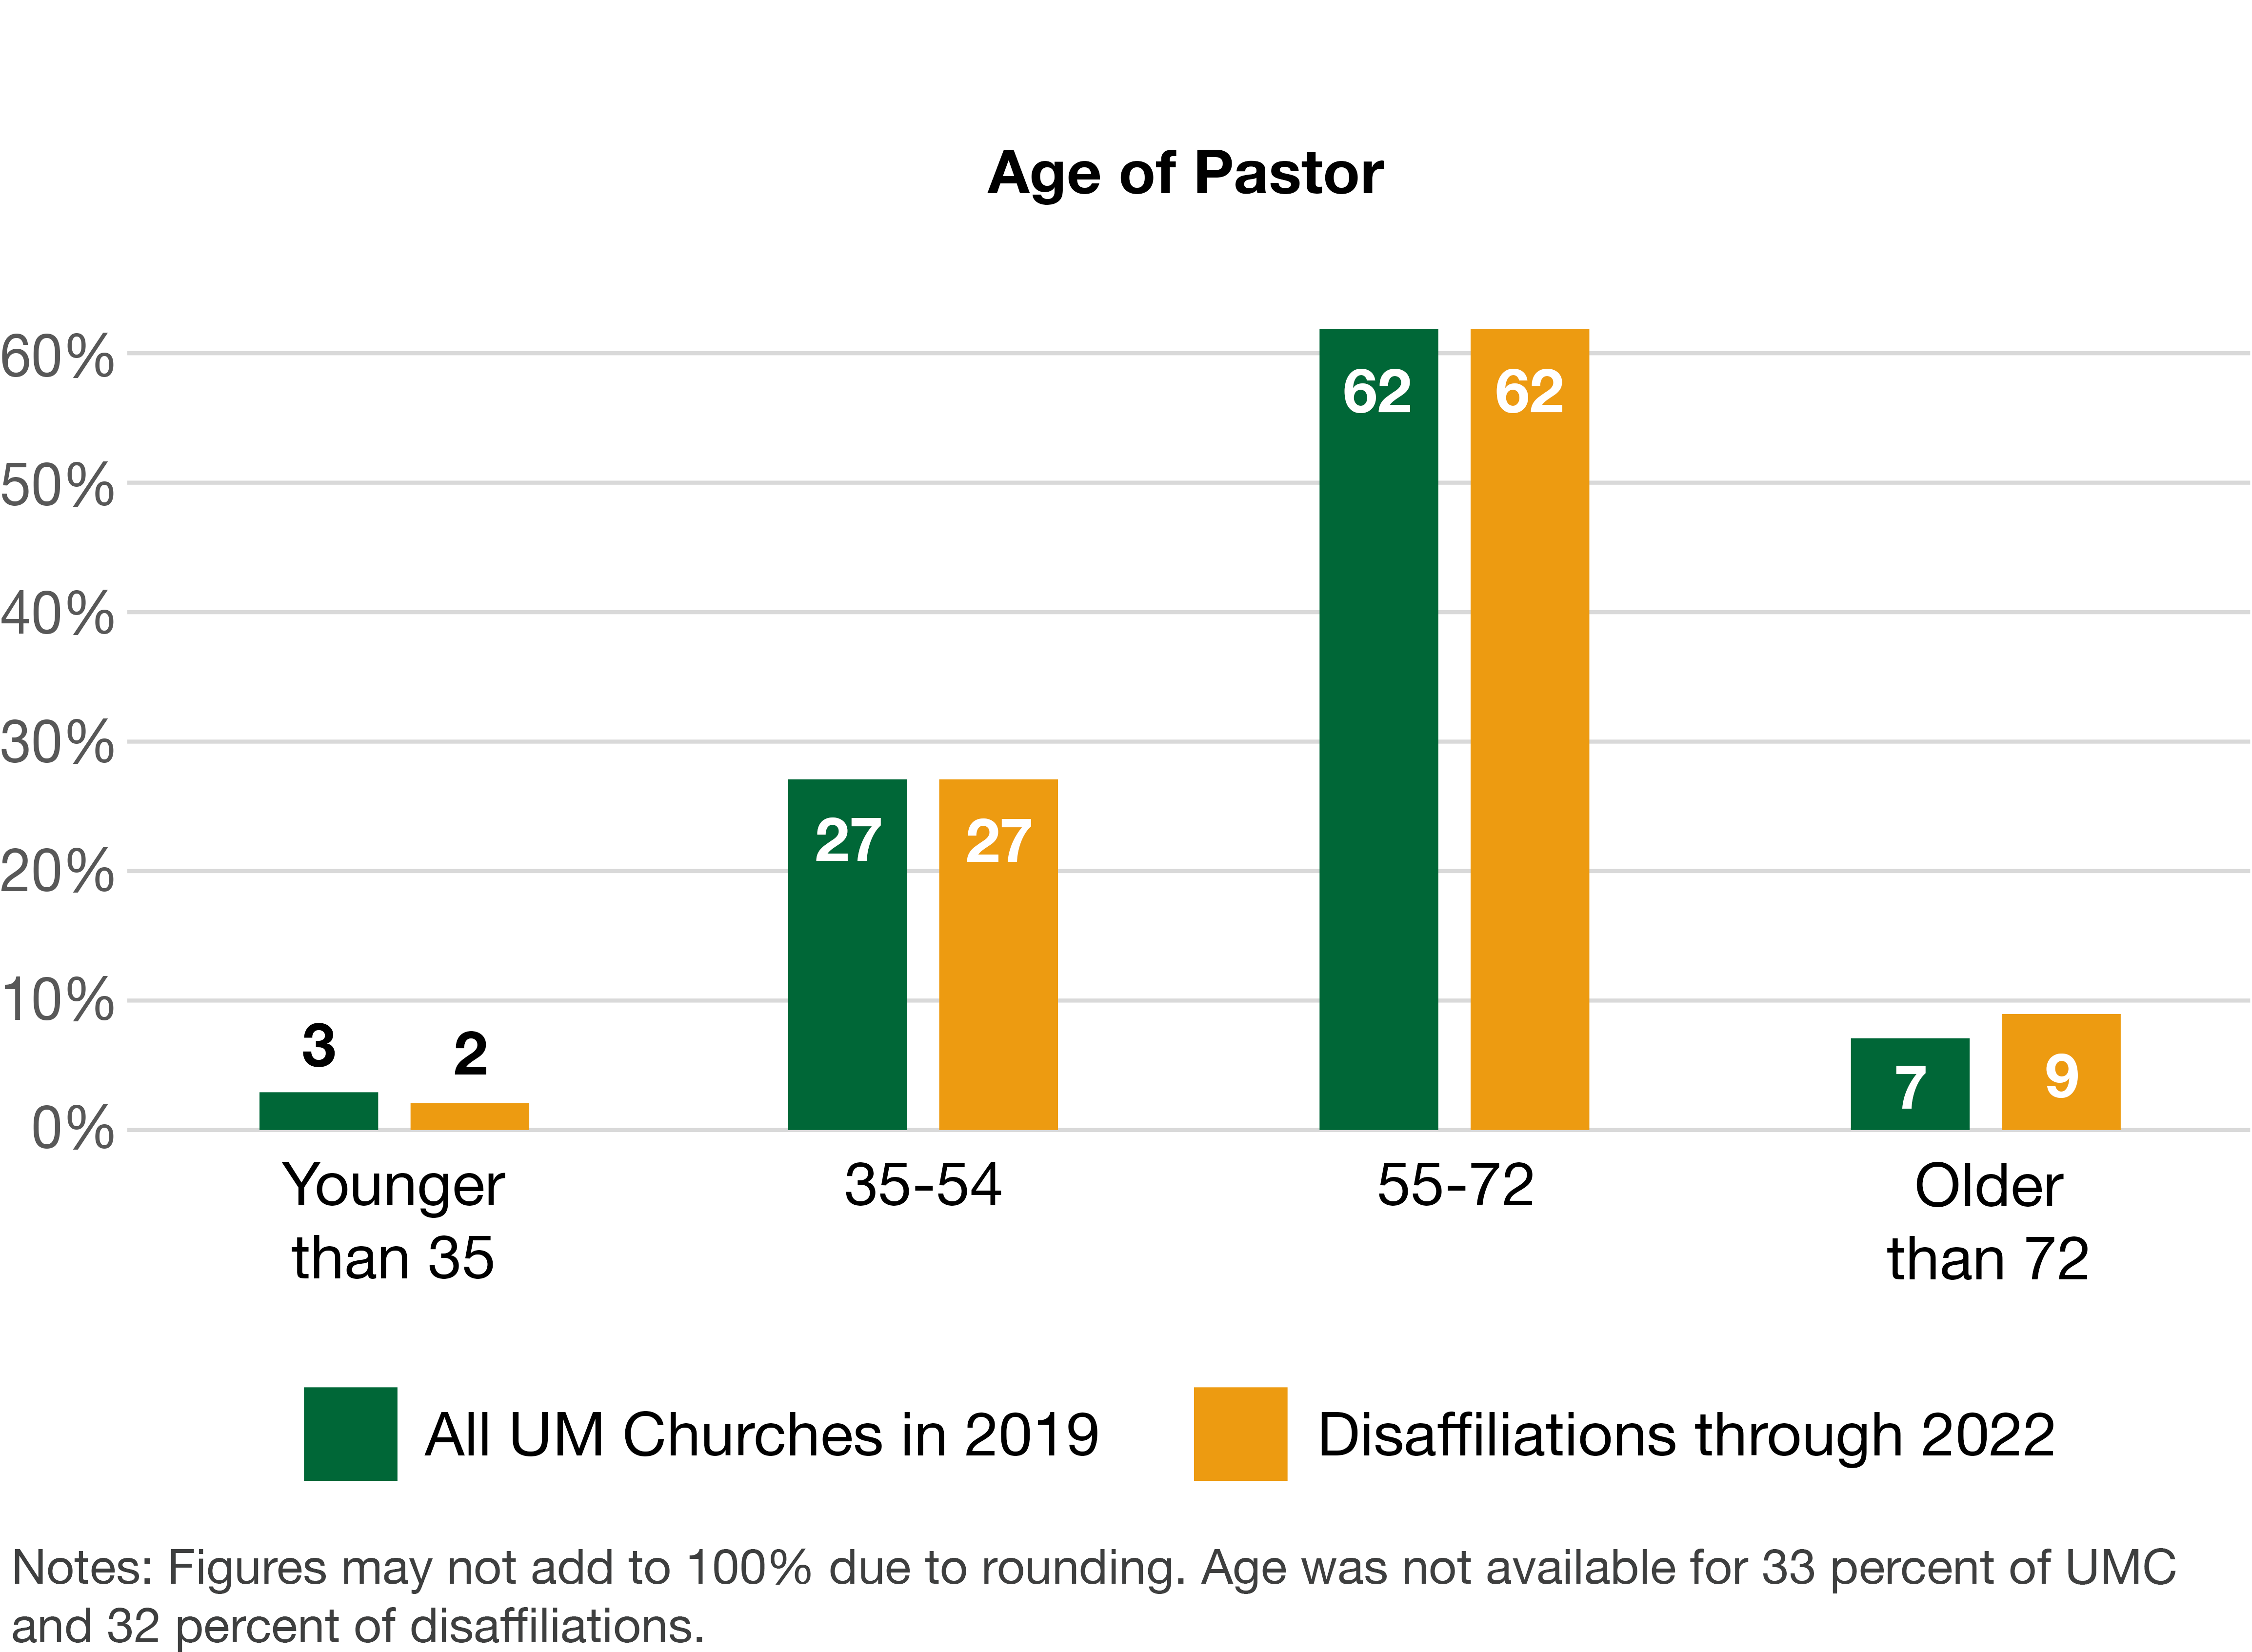
 Clergy Age
Compared to all United Methodist churches, disaffiliating churches have pastors who are about the same age though with slightly more who are retired.
Clergy Age
Compared to all United Methodist churches, disaffiliating churches have pastors who are about the same age though with slightly more who are retired.
Congregational Characteristics
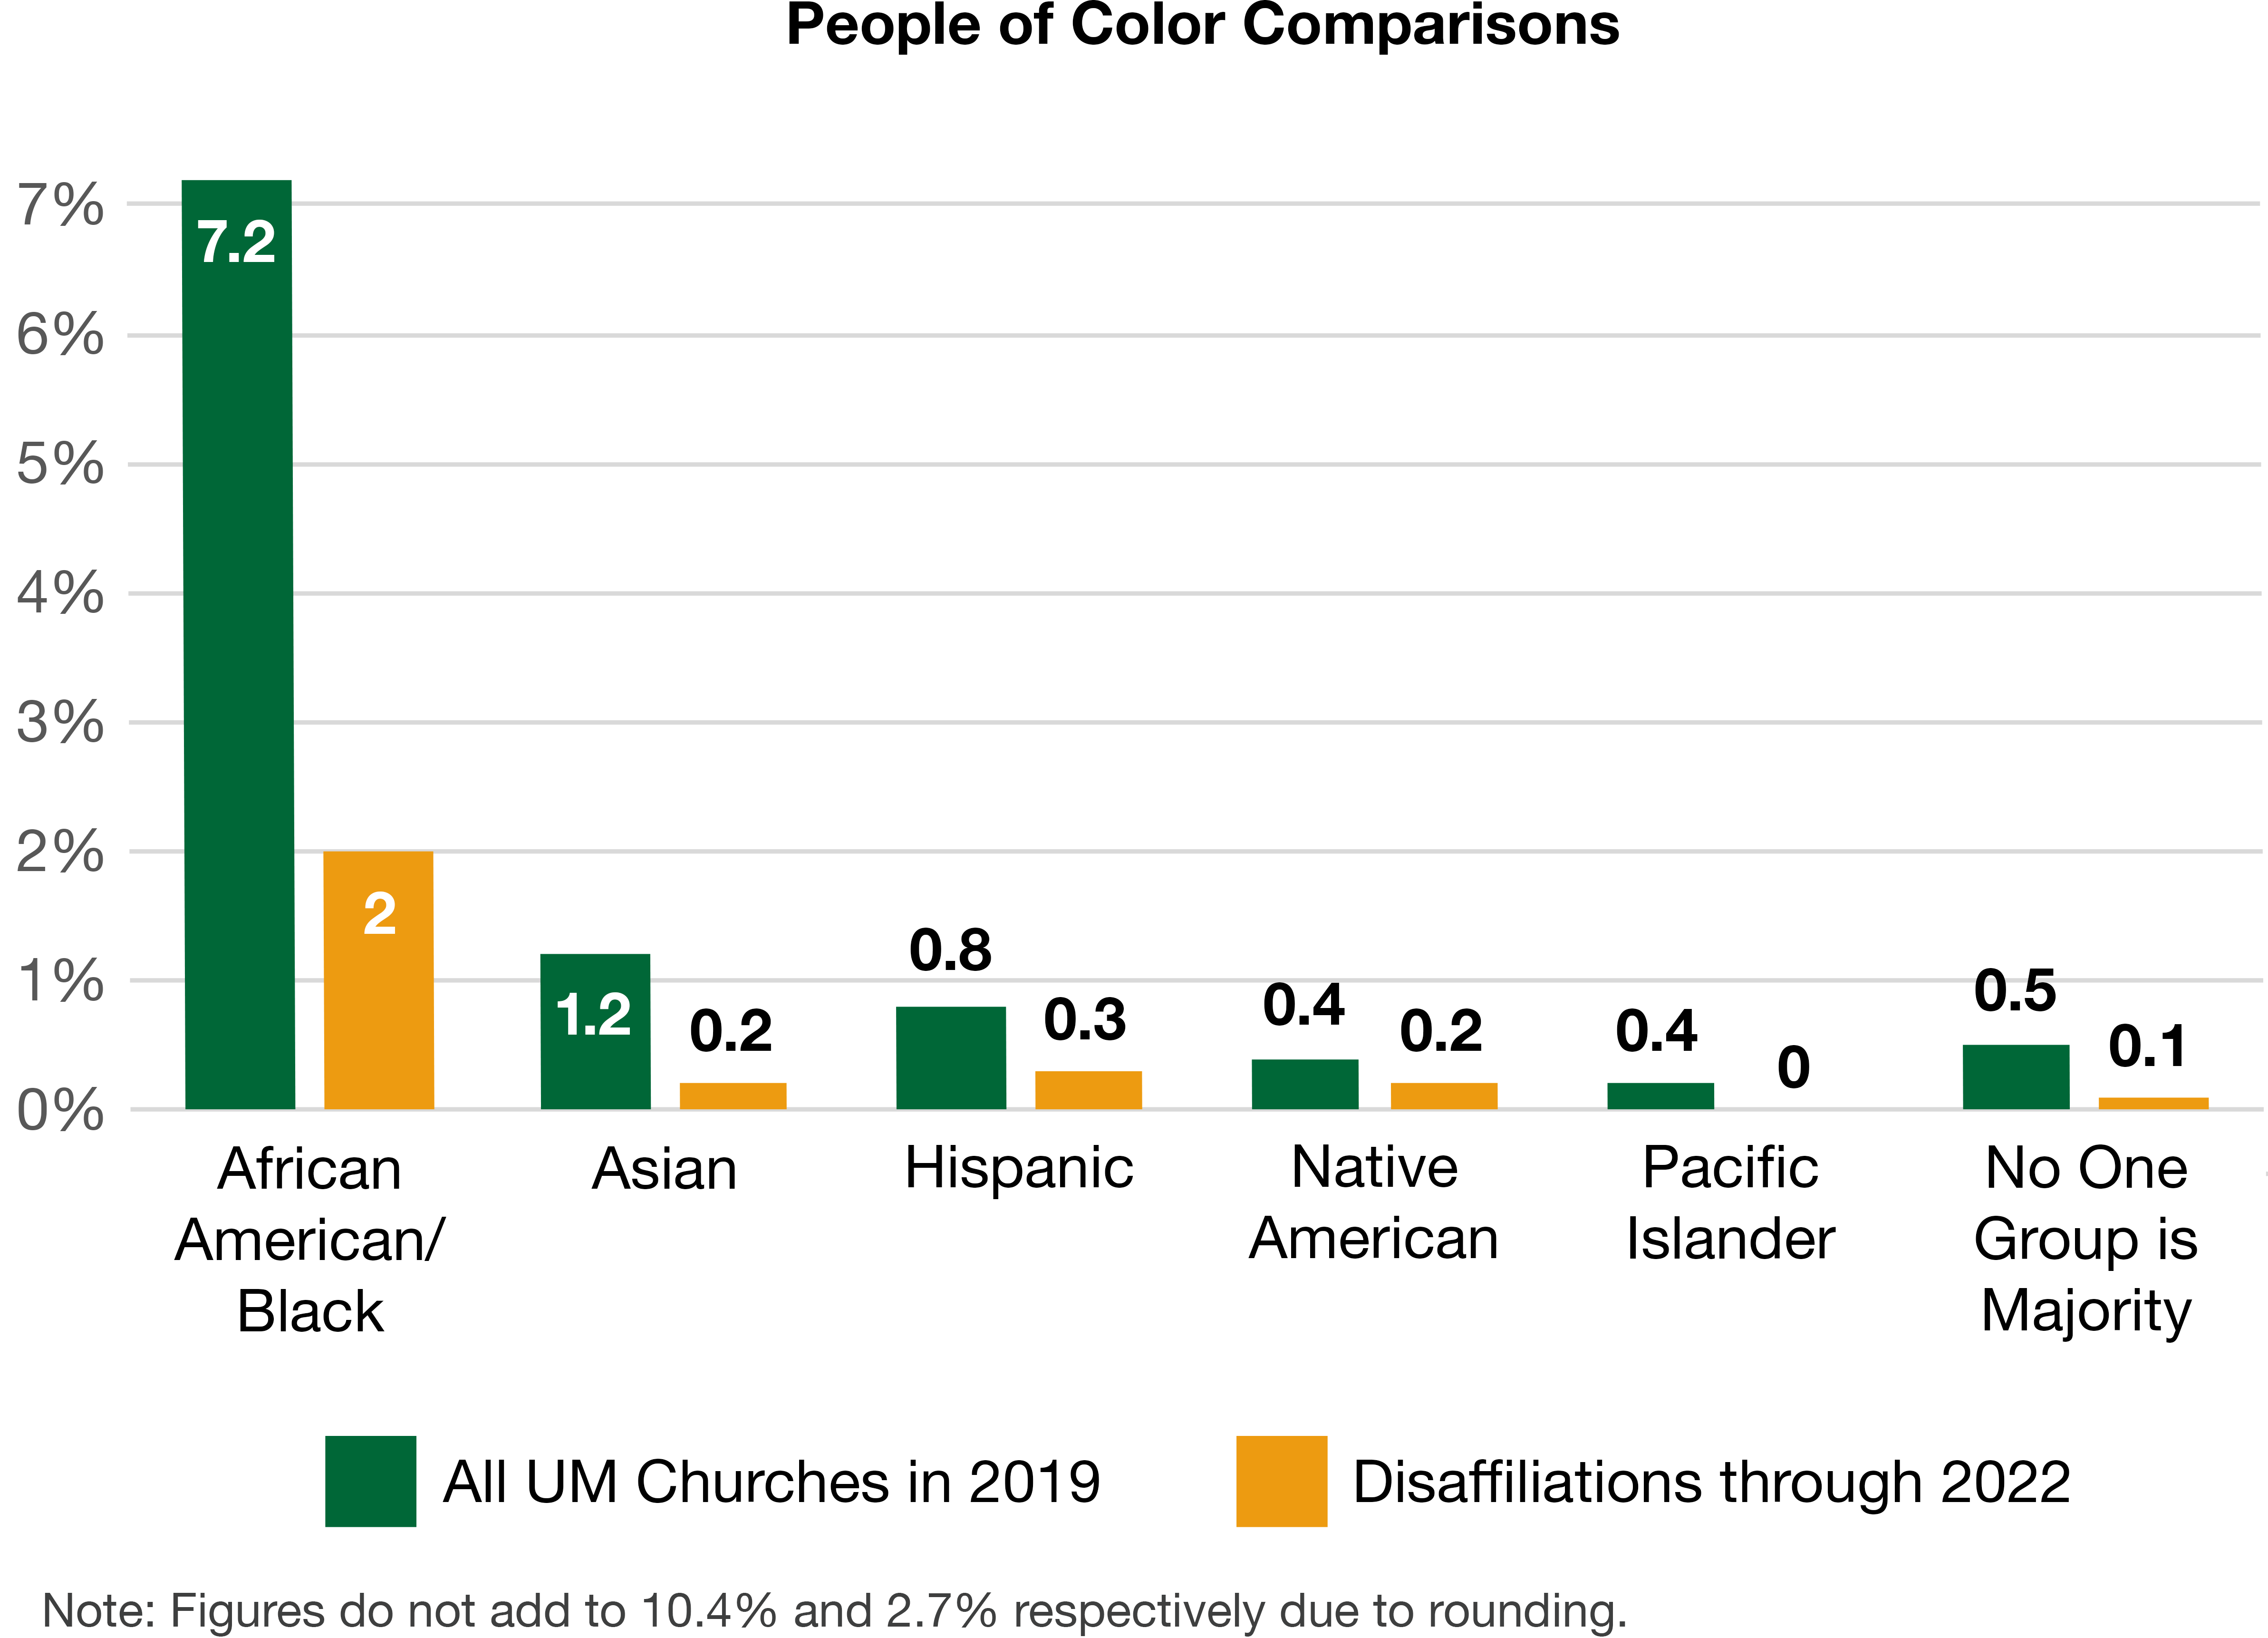
Race and Ethnicity Compared to all United Methodist churches, disaffiliating churches are overwhelmingly white. Among disaffiliating churches, over 97.3 percent report memberships that are majority white compared to 89.6 percent of United Methodist churches as a whole that are majority white.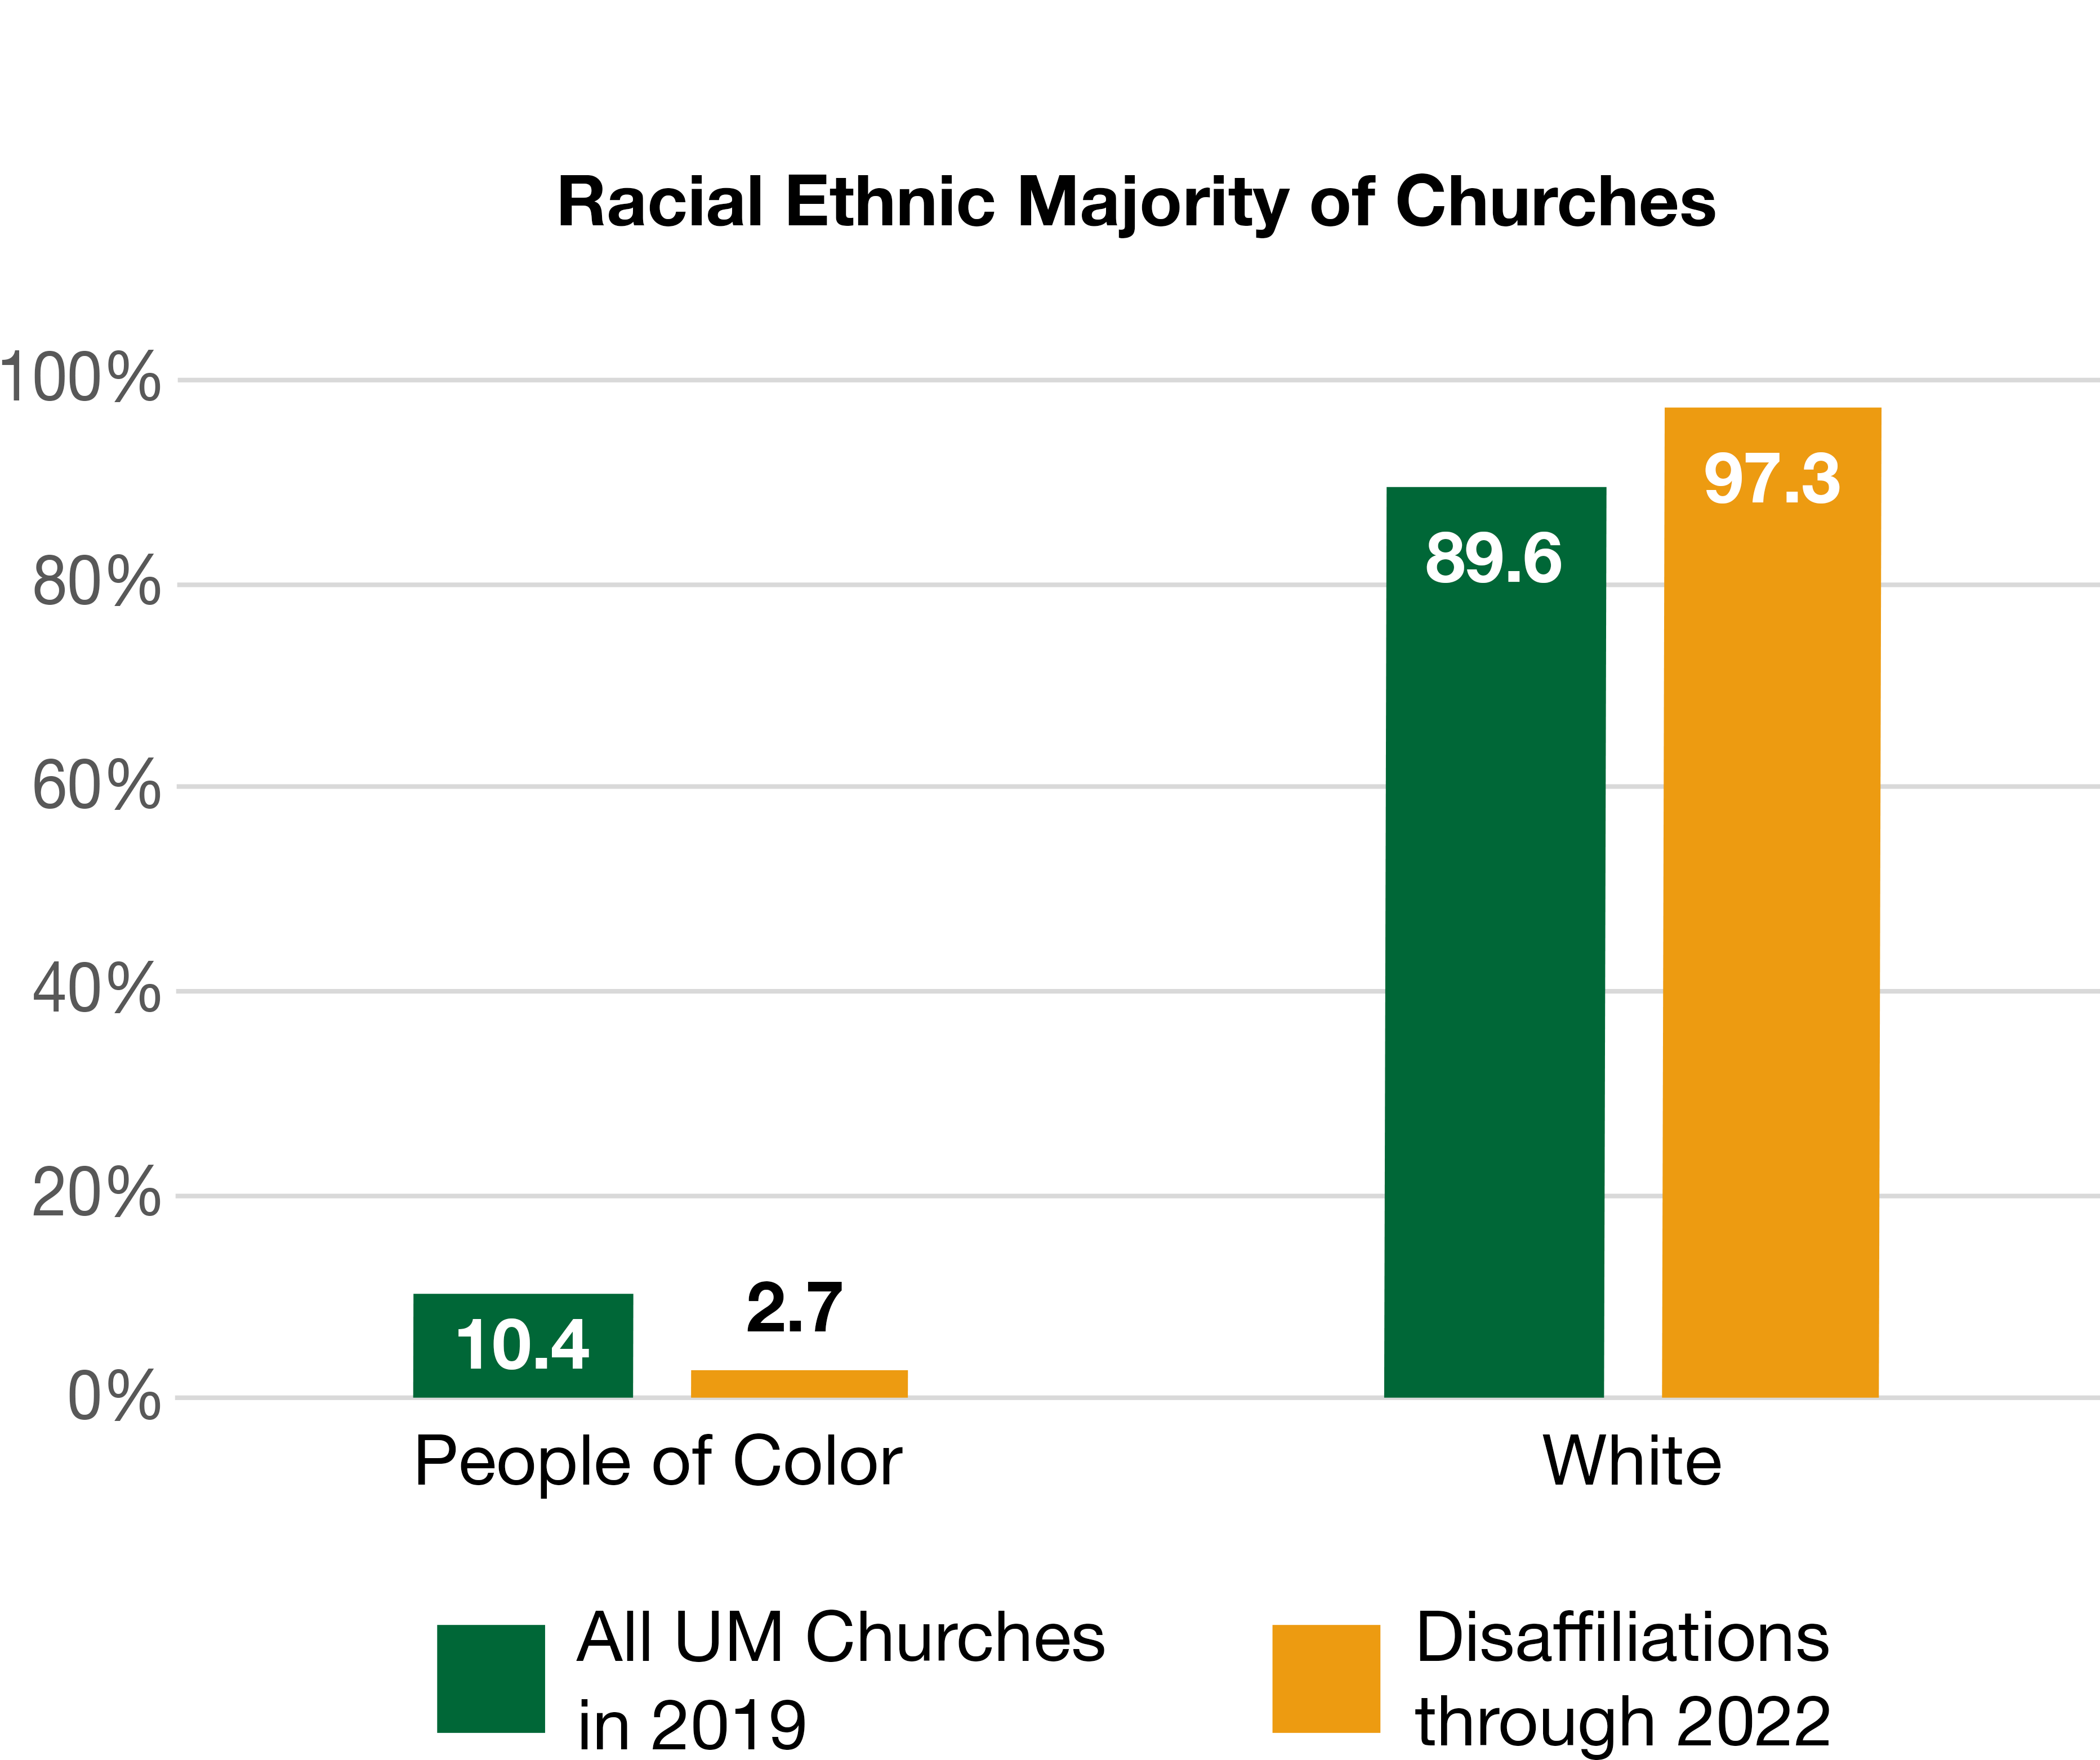
 Congregational Size
Compared to all United Methodist churches, disaffiliating churches are about the same mixture of churches by attendance size groupings.
Disaffiliating churches and all United Methodist churches match in the sizes of congregations based on worship attendance cohorts for churches with 51 or more attendance. For the nearly two-thirds of total United Methodist churches and disaffiliating churches with 50 or fewer in attendance, disaffiliating churches have proportionately more in the 26-50 attendance group and fewer in the 25 or fewer attendance group than the United Methodist pool as a whole. The median worship attendance of both groups of churches is about the same (38 for UMC and 40 for disaffiliations).
Congregational Size
Compared to all United Methodist churches, disaffiliating churches are about the same mixture of churches by attendance size groupings.
Disaffiliating churches and all United Methodist churches match in the sizes of congregations based on worship attendance cohorts for churches with 51 or more attendance. For the nearly two-thirds of total United Methodist churches and disaffiliating churches with 50 or fewer in attendance, disaffiliating churches have proportionately more in the 26-50 attendance group and fewer in the 25 or fewer attendance group than the United Methodist pool as a whole. The median worship attendance of both groups of churches is about the same (38 for UMC and 40 for disaffiliations).
| Percentage of Churches by Average Worship Attendance (AWA) | All UM Churches in 2019 | Disaffiliations through 2022 |
| 1,000+ AWA | 1% | 1% |
| 501-999 AWA | 1% | 2% |
| 251-500 AWA | 4% | 4% |
| 101-250 AWA | 13% | 11% |
| 51-100 AWA | 20% | 20% |
| 26-50 AWA | 27% | 31% |
| 25 or fewer AWA | 35% | 30% |
 At the same time, United Methodist churches as a whole had proportionately more professions of faith relative to their attendance (one profession of faith for every 30 in average worship attendance) than disaffiliating churches (one profession of faith for every 56 in attendance).
Another measure is to compare professions of faith (new people coming to faith) and deaths. While deaths exceeded professions of faith for both disaffiliating churches and all United Methodist churches, the gap was greater for disaffiliating churches. Deaths exceeded professions of faith for all United Methodist churches by 6 percent. Deaths exceeded professions of faith in disaffiliating churches by 43 percent. (Note: 2019 marked the first year ever in which there were more deaths than professions of faith in the United Methodist Church.)
At the same time, United Methodist churches as a whole had proportionately more professions of faith relative to their attendance (one profession of faith for every 30 in average worship attendance) than disaffiliating churches (one profession of faith for every 56 in attendance).
Another measure is to compare professions of faith (new people coming to faith) and deaths. While deaths exceeded professions of faith for both disaffiliating churches and all United Methodist churches, the gap was greater for disaffiliating churches. Deaths exceeded professions of faith for all United Methodist churches by 6 percent. Deaths exceeded professions of faith in disaffiliating churches by 43 percent. (Note: 2019 marked the first year ever in which there were more deaths than professions of faith in the United Methodist Church.)
Location Characteristics
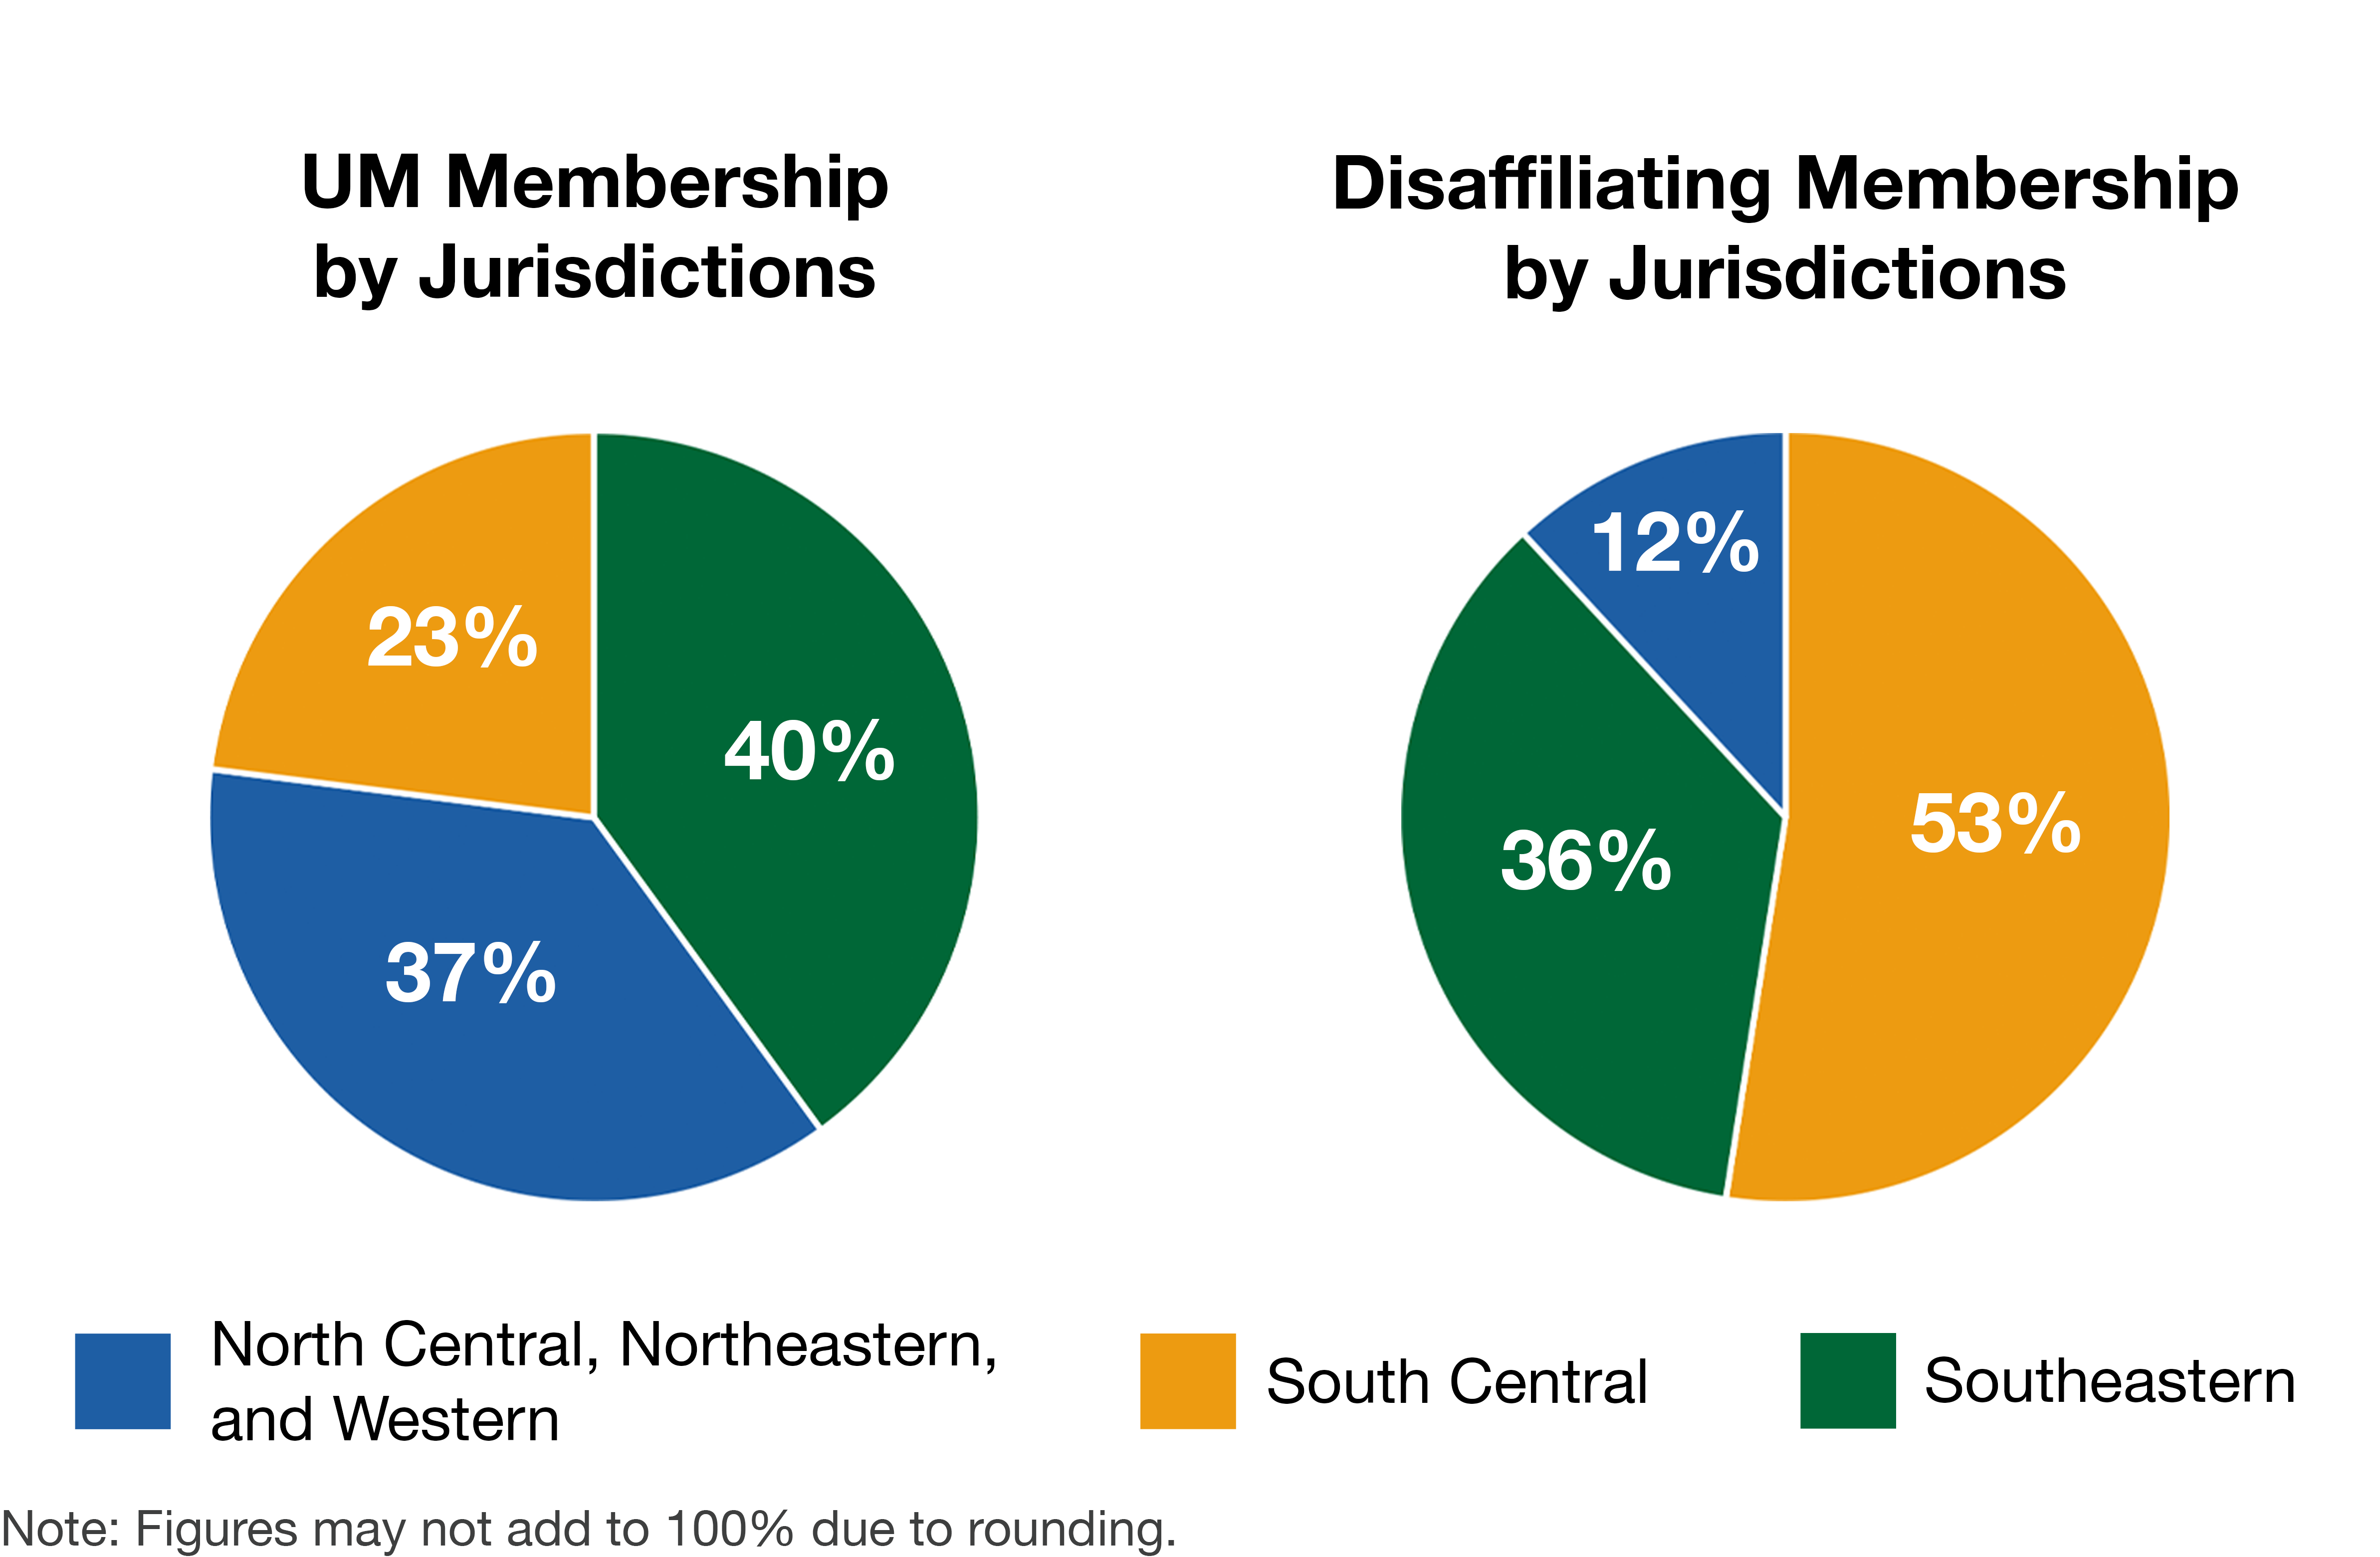
Regions Churches Compared to all United Methodist churches, disaffiliating churches are disproportionately in the South. The South Central and Southeastern Jurisdictions comprise 52 percent of United Methodist churches and 84 percent of disaffiliations.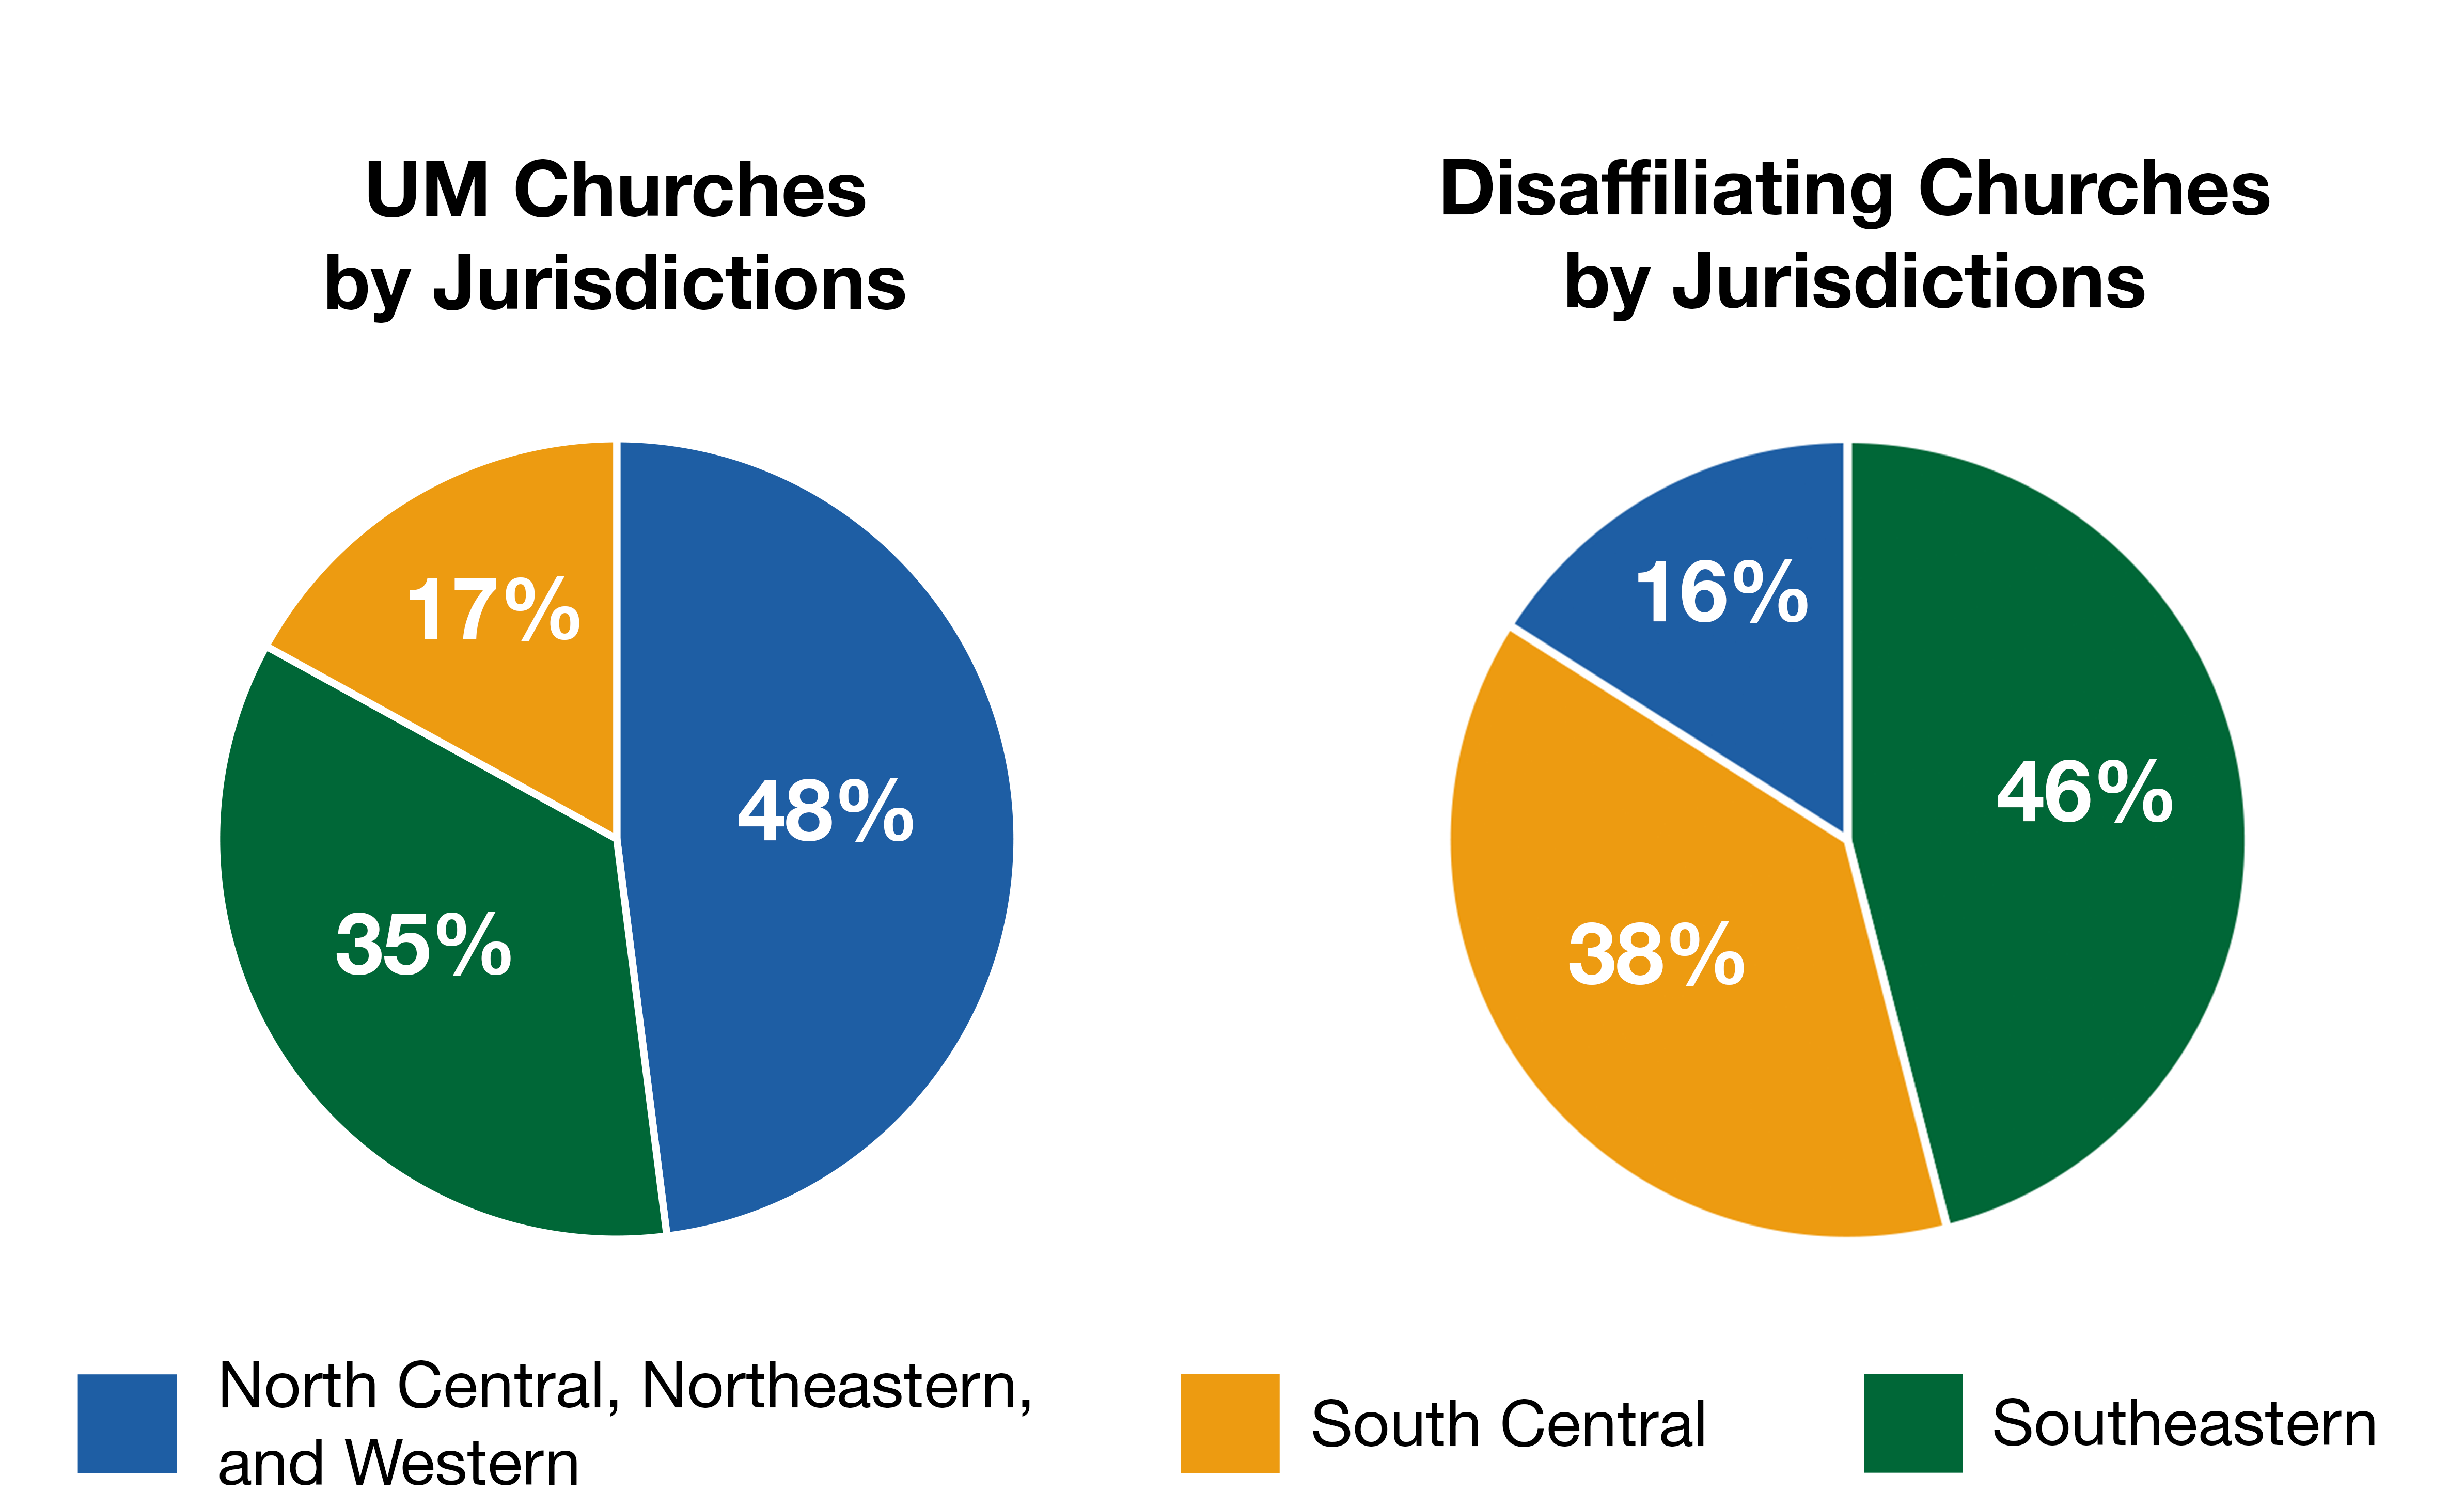 Membership
The South Central and Southeastern Jurisdictions comprise 63 percent of United Methodist membership and 89 percent of the membership in disaffiliating churches.
Membership
The South Central and Southeastern Jurisdictions comprise 63 percent of United Methodist membership and 89 percent of the membership in disaffiliating churches.
 Population
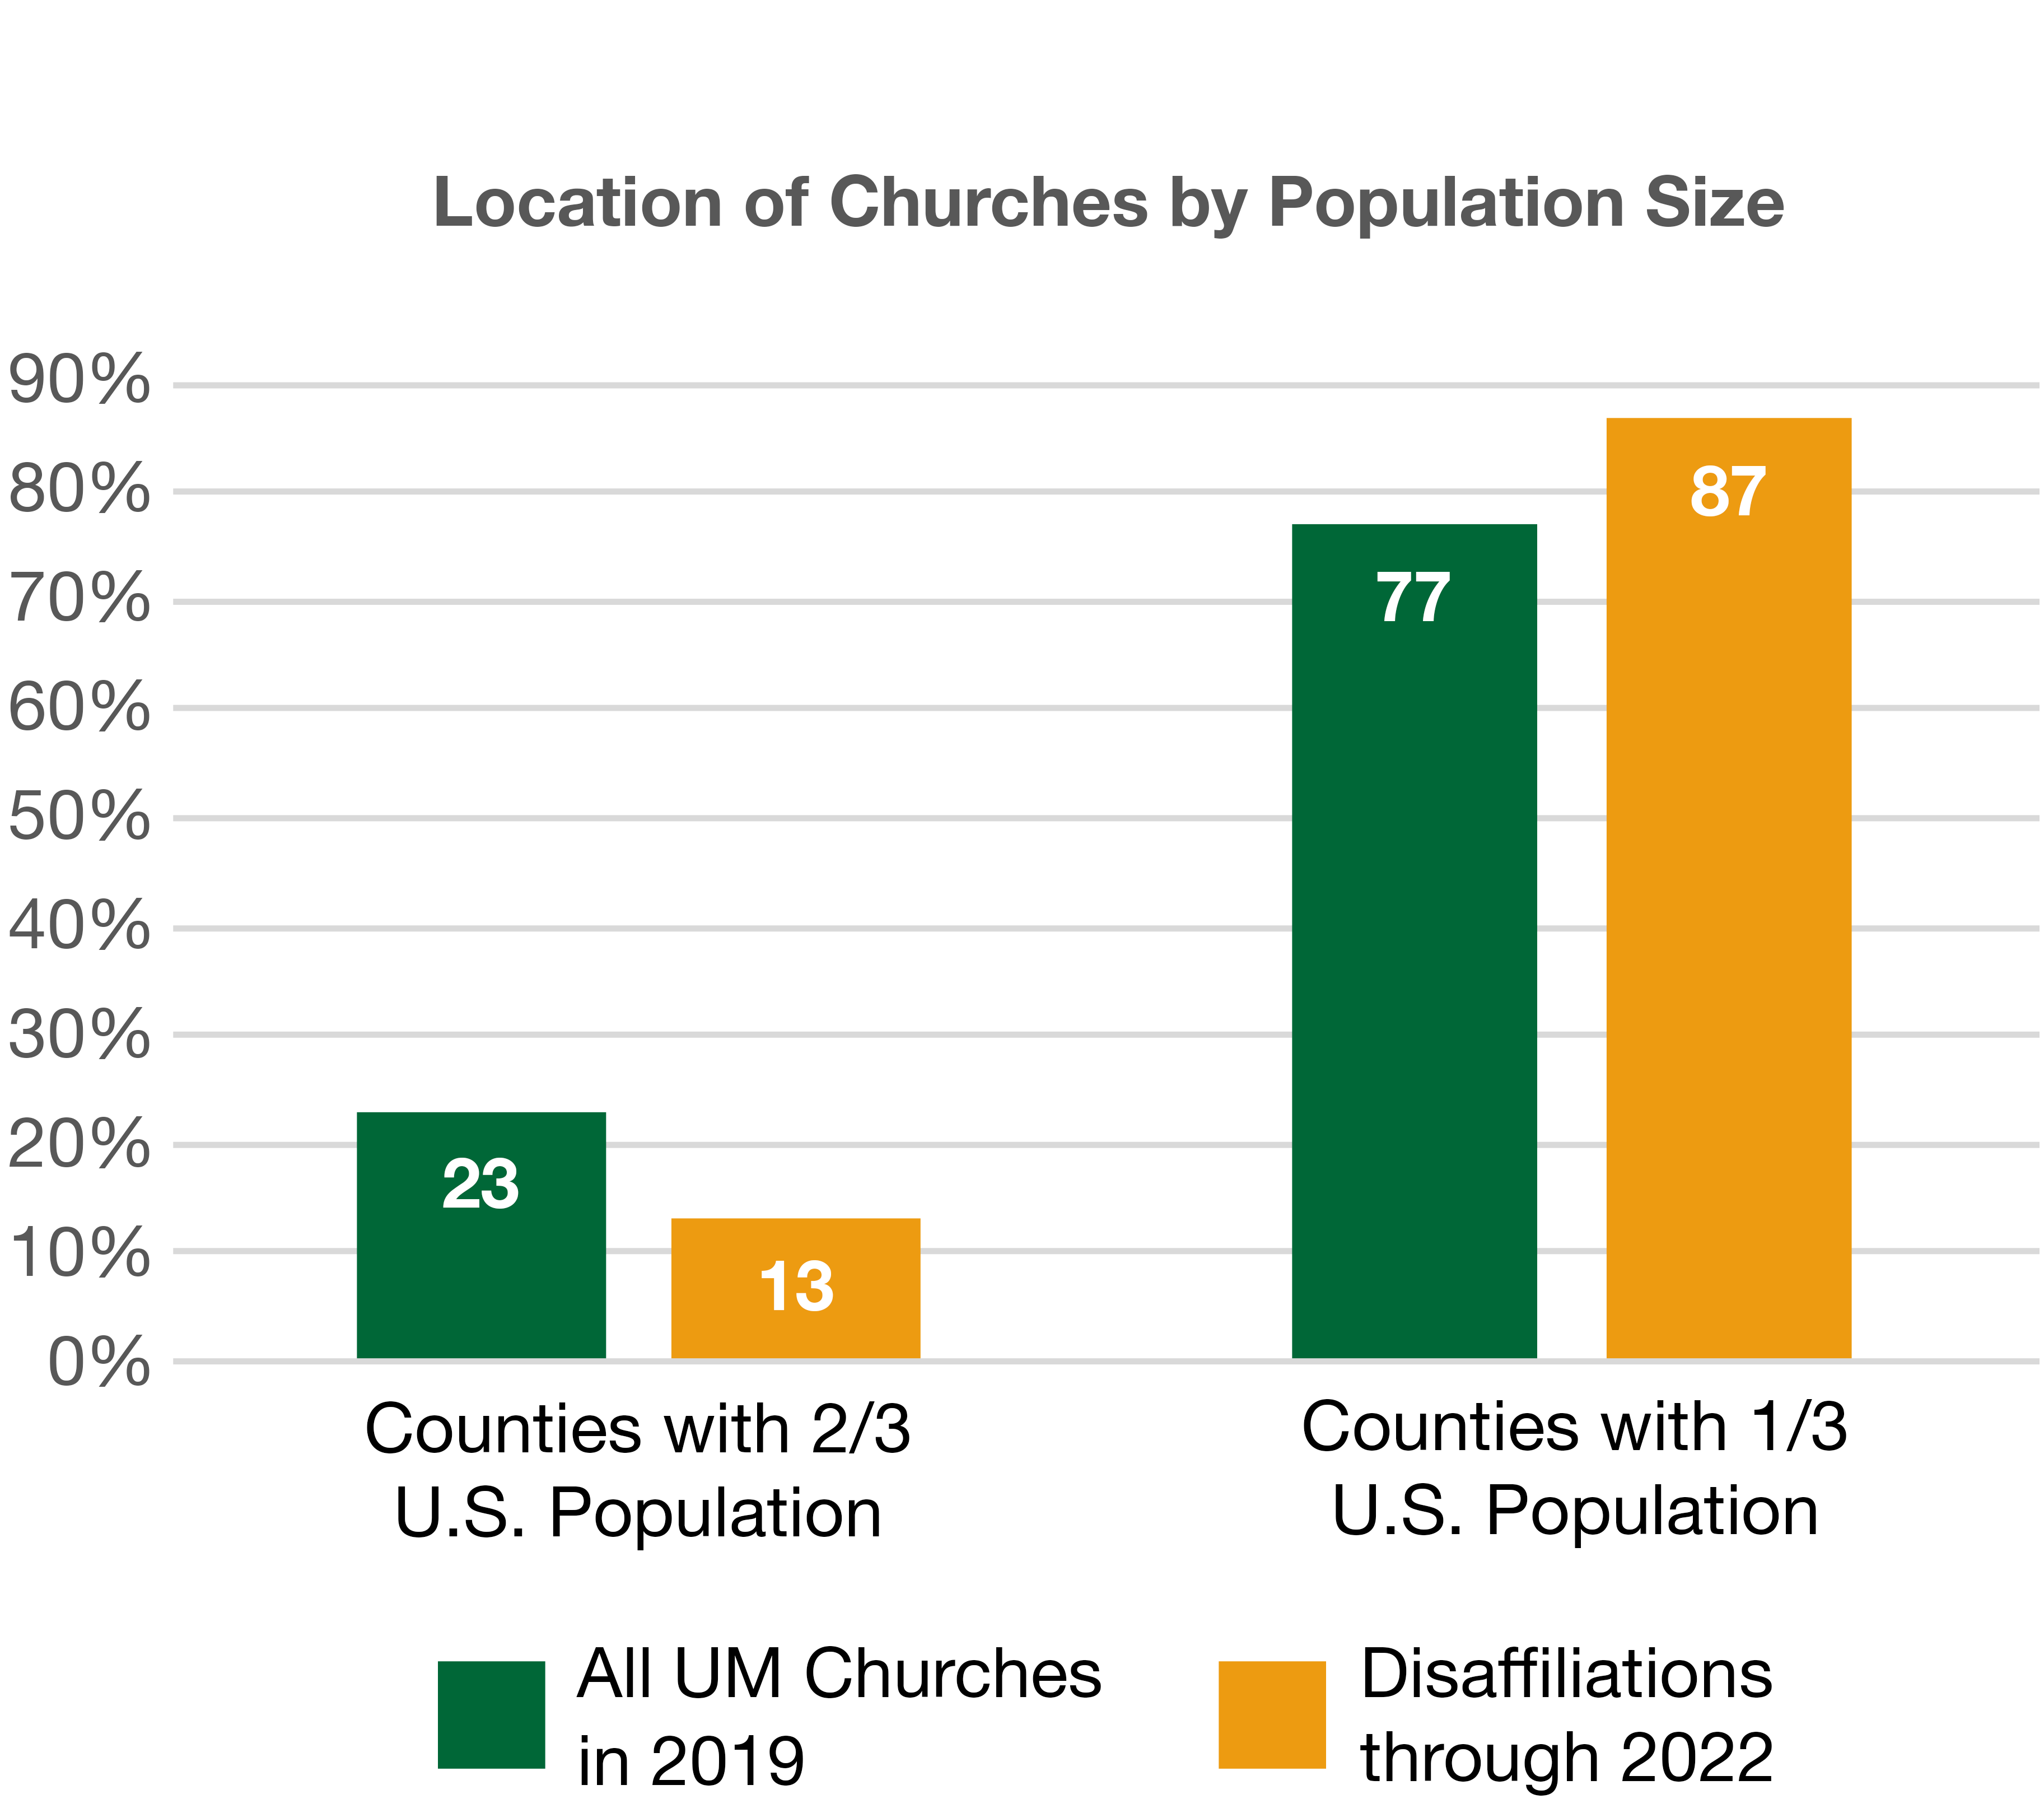
Compared to all United Methodist churches, disaffiliating churches are disproportionately in less heavily populated counties.
With population shifts in the U.S., there are many more counties that have lost population. Today two-thirds of the U.S. population lives in about 10 percent of the counties, just over 300 counties. The remaining one-third of the population lives in the far larger number of less densely populated counties. Only 13 percent of disaffiliating churches are in the more heavily populated counties where two-thirds of the population lives compared to 23 percent of all United Methodist churches.
Population
Compared to all United Methodist churches, disaffiliating churches are disproportionately in less heavily populated counties.
With population shifts in the U.S., there are many more counties that have lost population. Today two-thirds of the U.S. population lives in about 10 percent of the counties, just over 300 counties. The remaining one-third of the population lives in the far larger number of less densely populated counties. Only 13 percent of disaffiliating churches are in the more heavily populated counties where two-thirds of the population lives compared to 23 percent of all United Methodist churches.
Conclusion
It is impossible to know if further disaffiliations will mirror the characteristics of this first group of about 2,000 churches. There is a good chance that some patterns that are pronounced in their variation from overall United Methodist patterns may continue. The greater differences we found for disaffiliating churches compared to all churches came in the majority racial makeup of the congregation (white), location (Southern), and gender of the pastor (male). It will be interesting to see to what extent these distinctive features continue for disaffiliating churches. Lovett H. Weems, Jr. Senior Consultant, Lewis Center for Church Leadership Distinguished Professor of Church Leadership Emeritus, Wesley Theological SeminaryResearch Project
Church statistical data come from the reports that each congregation submits to its annual conference annually. They are collected and kept by the General Council on Finance and Administration (GCFA), with each church designated by a number. The GCFA makes this data available to denominational entities such as the Lewis Center for Church Leadership through an agreement regarding terms of usage. The data for both groups of churches comes from the 2019 reports since that is the year before disaffiliations began and thus there are same-year statistics for churches remaining and disaffiliating. We are able to do this report because the Lewis Center already had the total United Methodist statistics on most of these topics as part of a multi-year Religious Workforce Project that includes the United Methodist Church and other Christian denominations in the United States. Some of the topics covered are beyond what is contained in the annual statistical reports, and our information must come from other sources. For example, the statistical reports indicate the counties in which United Methodist churches are located. We are able then to do comparisons of churches by the location relative to population from the Census Bureau.Research Notes
About 2,000 churches disaffiliated by December 31, 2019. Our report covers almost all of them. We were able to identify the names and GCFA numbers for 1,967 of the group. There are some topics for which we do not have the information for all of these churches. They are noted below.
Type of Lead Pastor Notes
• Elders include full elders and provisional elders.
• Deacons typically do not serve as lead pastors but occasionally do.
• Retired includes all categories of clergy.
• Lay Supply includes certified lay ministers, but most in this group are categorized by annual conferences as lay supply, lay pastors, to be supplied, etc.
Racial Ethnic Majority of Churches
• There are many valid ways to measure the racial makeup of congregations. Here we are classifying based on the majority (51 percent or more) race reported for its membership.
• We had sufficient information for calculations from most but not all congregations. For the total UMC group, 1.7 percent of churches had missing or flawed data. For disaffiliating churches, all but two churches had data for analysis.
Median Worship Attendance
• Half the churches have larger attendance, and half have smaller attendance than the median.
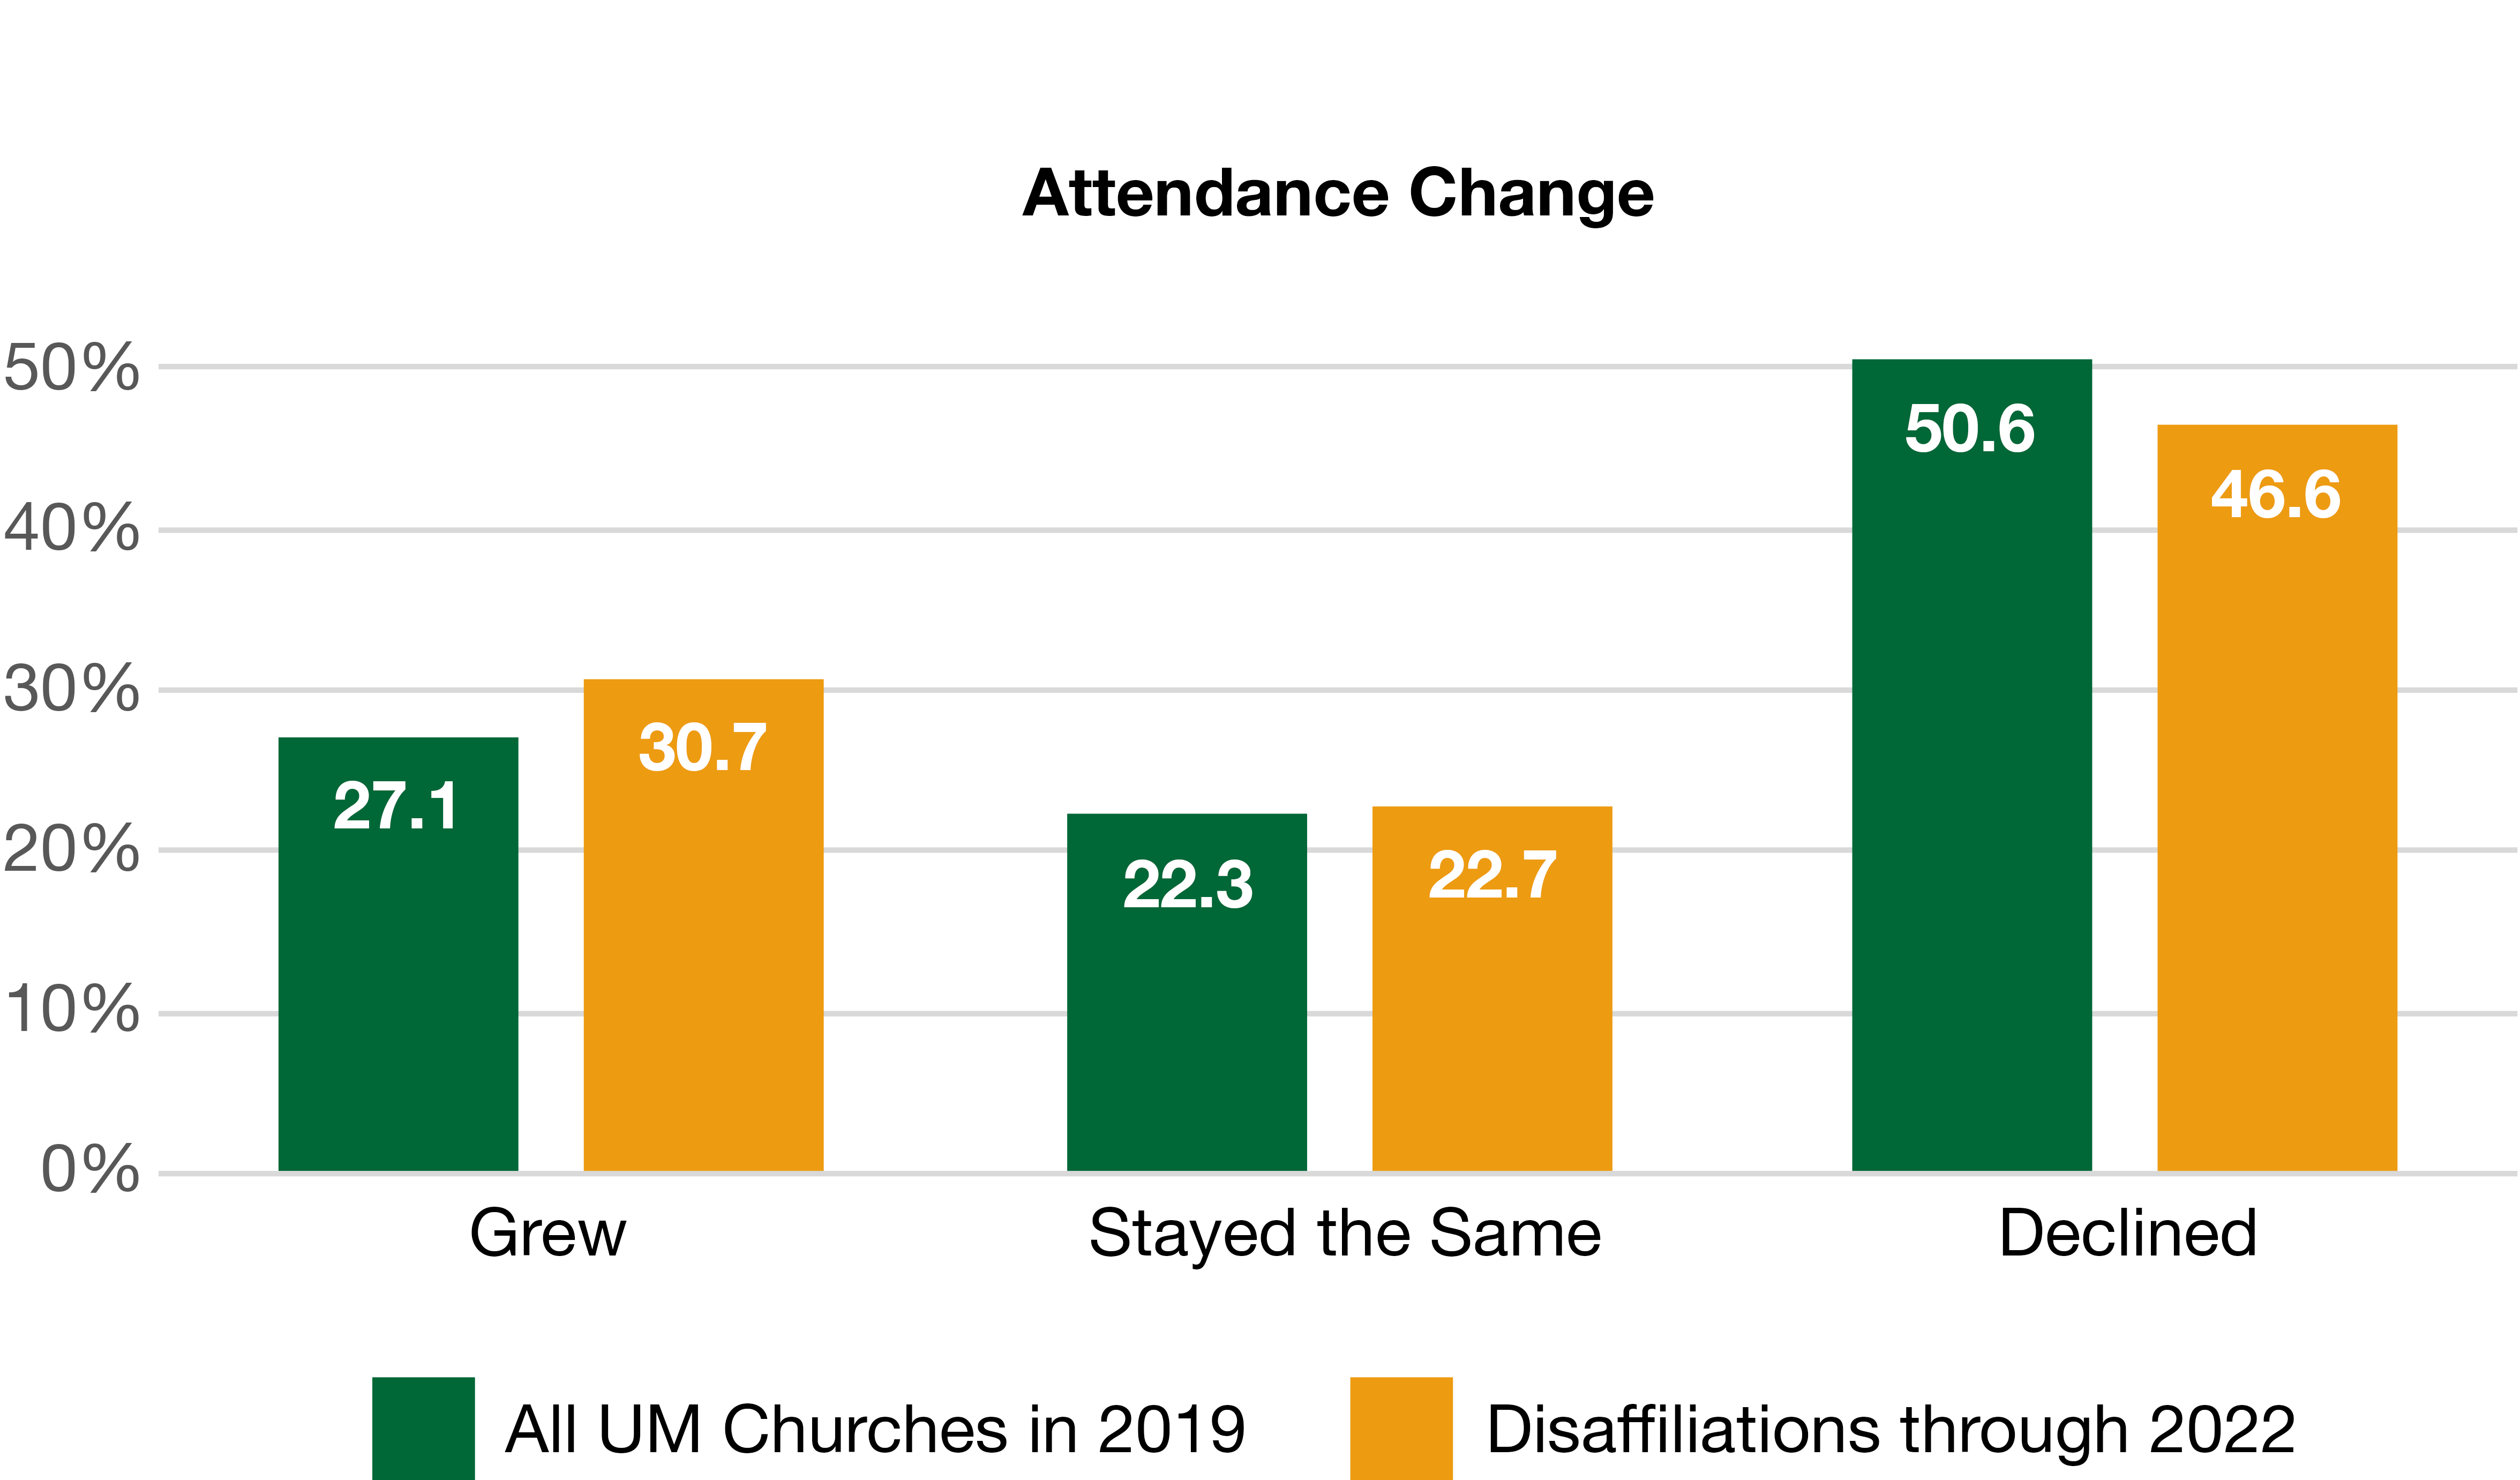
Attendance Change in 2019
• We had sufficient information for calculations from 99 percent of congregations in both comparison groups.
Professions of Faith and Worship Attendance
• This identifies how many professions of faith a church has relative to its size as measured in average worship attendance. The number of worshipers required for each profession of faith has been going up steadily for many years in the UMC.
Professions of Faith Compared to Deaths
• Across the UMC as far back as we have records, the number of professions of faith exceeded deaths each year, by large margins until recent years, until 2019 when there were more deaths than professions of faith.
Location of Churches by Population Size
• We had data for 1,965 churches out of 1,967 disaffiliating churches for these calculations.
• The population of the United States has been shifting as well as growing for a long time. In each recent census, a relatively small number of counties are home to two-thirds of the nation’s population. That leaves many more counties in which only one-third of the population lives.


