Presenter

Dr. Lovett H. Weems, Jr., distinguished professor of church leadership and director of the Lewis Center
About the Congregational Attendance Profile
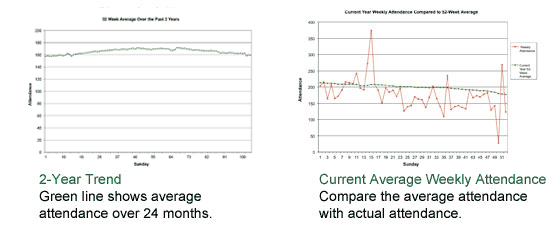
Congregational Attendance Profile doesn’t just track attendance — it reveals clues to improve attendance. CAP effortlessly produces a two-year trends chart showing the big picture — whether overall attendance is rising, declining, or flat. A seasonal attendance chart superimposes your 52-week average over actual attendance, revealing peaks and dips. On a CAP video segment, Lewis Center Director Lovett H. Weems, Jr., explains how to interpret and use this data. Churches have shown major improvement in attendance by acting on lessons learned from CAP. Simply input your past attendance figures into the CAP spreadsheet, then once a week add your latest numbers. Congregational Attendance Profile automatically does the rest, and it works for churches with single worship services as well as those with many.

The Resource Includes:
- Easy-to-use templates that calculate your congregation’s unique Congregational Attendance Profile to better monitor worship attendance throughout the year
- Step-by-step video presentation on how to get started using CAP
- Video instruction featuring Dr. Lovett H. Weems, Jr., director of the Lewis Center, which explains how to understand and interpret CAP charts
- Sample charts from real churches’ Congregational Attendance Profiles
- Frequently Asked Questions
- Instructional Segments
-
Part I: Overview
Explains the purpose of the Congregational Attendance Profile (CAP) and the concept of a 52-week running average.
- Video Presentation (4:02 min), Dr. Lovett H. Weems, Jr., distinguished professor of church leadership and director of the Lewis Center
- Video Transcript
Part II: Using the Excel Files
A detailed walk-through of how to use the Excel files, enter attendance data, and produce summary charts. This portion of the resource is intended for the individual responsible for recording attendance information.
52-Week CAP for a Single Service
- Video Presentation (6:05 min)
- Video Transcript
- 52-Week CAP.xls
52-Week CAP for Multiple Services
- Video Presentation (8:07 min)
- Video Transcript
- 52-Week CAP, Multiple Services.xls
Part III: What CAP Reveals
This presentation helps a congregation see the trends and clues that can be learned from the Congregational Attendance Profile. This segment, together with the overview, can be used by congregational groups, church staff, or evangelism committees to consider strategies for building attendance.
- Video Presentation (10:19 min)
- Video Transcript
- Sample Chart: 2-Year Trend, Church 1
- Sample Chart: 2-Year Trend, Church 2
- Sample Chart: 2-Year Trend, Church 3
- Sample Chart: Current Year AWA, Church 1
- Sample Chart: Current Year AWA, Church 2
Frequently Asked Questions
Provides succinct answers to questions that commonly arise among CAP users.


